Band 6.0 IELTS Writing Task 1 Model Answer
Overall Band Score: 6.0 · Cambridge IELTS 11 · 2026-11-06
IELTS Writing Task 1 question
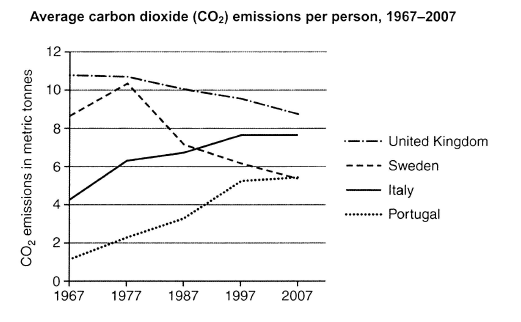
The graph below shows average carbon dioxide (CO2) emissions per person in the United Kingdom, Sweden, Italy and Portugal between 1967 and 2007.
Summarise the information by selecting and reporting the main features, and make comparisons where relevant.
Student answer (Band 6.0)
The line graph illustrate the average carbon dioxide emissions per person across four countries, the Uk, Sweden, Italy and portugal between 1967 to 2007.
Overall, The britain is the highest for co2 emission, Whereas, Sweden and Portugal has opposite trend but in the year end they shared identical numbers of Co2 emission, while Italy was increased the Co2 emitted all over the period.
The united kingdom was emitted Co2 approximetly 11 metric tonnes in year 1967 and gradually decreased over the period and it stood at between 8 to 10 metric tonnes. More than 4 metric tonnes Co2 was emitted by the Italy in 1967 and it was rose graduallyand reach up to 7.10 metric tonnes by the 2007.
Whereas, Sweden and Portugal showed opposite trend all over 50 years, Sweden in 1967 stood at co2 emission was more than 8 metric tonnes, peak at 1977 was higher than 10 tonnes suddnely fell down after coming years and reach up to 5. 10 mertic tonnes by the end of the year. Wherease, Portugal showed less than 2 metric tonnes was emitted co2 in 1967 and it was gradually increasd and reach up to same as Sweden after 5 decades.
AI examiner evaluation
| Criterion | Band |
|---|---|
| Task Achievement / Task Response | 6.5 |
| Coherence and Cohesion | 6.5 |
| Lexical Resource | 5.5 |
| Grammatical Range and Accuracy | 5.0 |
| Overall | 6.0 |
Task Achievement / Task Response: Band 6.5
You identify the main overall patterns: the UK remains the highest emitter while declining, Italy rises, and Sweden and Portugal finish at similar levels. The response also includes relevant figures, such as the UK’s starting point of about 11 tonnes and Sweden’s peak above 10. This covers the key features, but some details are inaccurate or unclear: Italy is reported at 7.10 tonnes in 2007, whereas the graph shows about 7.6, and the UK’s final figure is described only as “between 8 to 10.” The overview’s claim that Sweden and Portugal have “opposite trend” is too broad; both change direction or rise/fall at different stages, so the comparison needs precision. More accurate endpoint reporting and a clearer overview would strengthen the response.
Coherence and Cohesion: Band 6.5
The response has a recognisable structure, moving from an introduction and overview to country-specific details. Grouping Sweden and Portugal together is useful because their figures converge by 2007, and linking expressions such as “Overall” and “Whereas” help signal relationships. However, progression is not consistently smooth: the UK and Italy are discussed together, then Sweden and Portugal are revisited in a long, crowded sentence. Some links are awkward or repetitive, particularly repeated uses of “Whereas,” and the reference in “it stood at between 8 to 10” is not precise. Organise the body into clearer comparisons and use more exact references to years and countries to make the sequence easier to follow.
Lexical Resource: Band 5.5
You use relevant task vocabulary, including “average carbon dioxide emissions,” “metric tonnes,” “gradually decreased,” and “peak,” so the reader can understand the main trends. There is also some attempt to vary expressions for change. However, the range and control are limited by repeated wording such as “emitted” and “reach,” and several choices are inaccurate or unnatural: “opposite trend,” “the UK is the highest,” and “fell down” do not express the comparisons precisely. Spelling errors such as “approximetly,” “suddnely,” and “increasd” are noticeable. Build a more reliable set of trend verbs and collocations, and check spelling and country-name capitalisation before submitting.
Grammatical Range and Accuracy: Band 5.0
You attempt both simple and more complex sentences, including comparisons introduced by “Whereas,” and the overall meaning is generally recoverable. However, grammatical control is uneven, with errors in agreement, verb forms, articles, and sentence construction. For example, “The line graph illustrate” needs subject–verb agreement, while “Sweden and Portugal has” should use a plural verb. Phrases such as “it was rose gradually” and “Sweden … stood at co2 emission was” show faulty verb patterns, and the opening sentence uses an unclear time construction (“between 1967 to 2007”). Some sentences also run together or lack clear punctuation. Practise accurate past-tense reporting and build complex sentences around one clear main clause.
See this exact question answered at other band scores. The same prompt compared across bands.
Browse more IELTS Writing model answers or get your own writing scored by the same AI examiner.