Band 4.0 IELTS Writing Task 1 Model Answer
Overall Band Score: 4.0 · Cambridge IELTS 11 · 2026-11-06
IELTS Writing Task 1 question
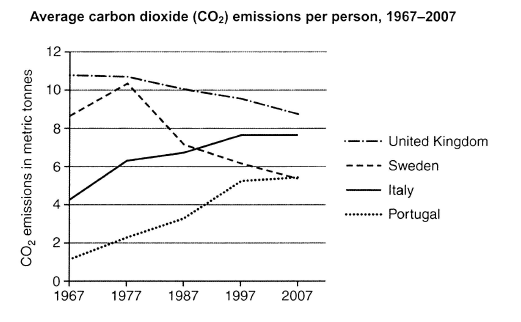
The graph below shows average carbon dioxide (CO2) emissions per person in the United Kingdom, Sweden, Italy and Portugal between 1967 and 2007.
Summarise the information by selecting and reporting the main features, and make comparisons where relevant.
Student answer (Band 4.0)
The line chart gives the information about the average carbon dioxide (CO2) emession per person in the four countries between 1967 and 2007.
Overall it is lucid that italy was the most shows average carbon dioxide while other countries shows less.
Feteching into details italy was the most shows carbondioxide from 1967 accounted at 5 to increase to 2007 followed by portugal was the second biggest shows average carbon dioxide from 1967 accounted at 1 to increase to 2007.
remaining detail the italy was the biggest followed by sweeden in 1967 increase 9 to 11 and than decrease as same as portugal and when its come on united kingtom was the least average carbon dioxide from [redacted phone] to drope it as same as italy. in the year 2007.
AI examiner evaluation
| Criterion | Band |
|---|---|
| Task Achievement / Task Response | 3.0 |
| Coherence and Cohesion | 4.5 |
| Lexical Resource | 4.5 |
| Grammatical Range and Accuracy | 4.5 |
| Overall | 4.0 |
Task Achievement / Task Response: Band 3.0
The response identifies the chart topic and attempts to describe changes in all four countries, but it does not give a reliable overview of the main features. The claim that Italy had the highest emissions is inaccurate for most of the period: the UK was highest throughout, while Italy rose from about 4.3 to 7.6 tonnes. The statement that the UK was “the least” is also incorrect; Portugal began lowest, and the UK declined only gradually. Several figures and comparisons are unclear or misreported, including “increase 9 to 11” for Sweden. The response is also 21 words below the required minimum, limiting the detail provided. Select the key overall trends accurately, then support them with a few clear comparisons.
Coherence and Cohesion: Band 4.5
There is a basic attempt to organise the response: an opening sentence is followed by an overview and further details, and phrases such as “Overall” and “remaining detail” signal stages in the description. However, the progression is difficult to follow because several ideas are crowded into long, unclear sentences. For example, the final sentence moves between Italy, Sweden, Portugal and the UK without clearly separating their trends. Connections such as “followed by” and “as same as” do not reliably show the intended comparisons. Use distinct paragraphs for the overview and details, and describe each country or related trend in a clear sequence with accurate linking phrases.
Lexical Resource: Band 4.5
The response uses some task-related vocabulary, including “line chart,” “average carbon dioxide,” “increase” and “decrease,” so the topic is recognisable. However, word choice and spelling are often inaccurate or repetitive, and some phrases make the meaning hard to understand. Examples include “the most shows,” “accounted at,” “Feteching into details,” and “drope it.” Country names and “emission” are also misspelled in places. Aim for precise chart language and natural collocations rather than repeating “shows average carbon dioxide.” Useful alternatives include “emissions per person,” “rose from,” “declined to,” and “remained stable.” Proofreading spelling and word forms would make the information clearer.
Grammatical Range and Accuracy: Band 4.5
The response attempts both simple and longer sentence forms, including an overview and sentences linked with “while,” “followed by” and “and then.” However, control of sentence structure is inconsistent, and errors frequently obscure relationships between the data. For instance, “Italy was the most shows” combines incompatible verb forms, while “other countries shows less” has faulty subject–verb agreement. The final sentence lacks a clear grammatical structure, making it difficult to identify what happened in each country. Use straightforward patterns such as “Emissions in Italy rose from … to …” and check agreement, articles and tense. Clear, accurate sentences should come before attempts to combine several comparisons.
See this exact question answered at other band scores. The same prompt compared across bands.
Browse more IELTS Writing model answers or get your own writing scored by the same AI examiner.