Band 4.0 IELTS Writing Task 1 Model Answer
Overall Band Score: 4.0 · Cambridge IELTS 11 · 2026-11-06
IELTS Writing Task 1 question
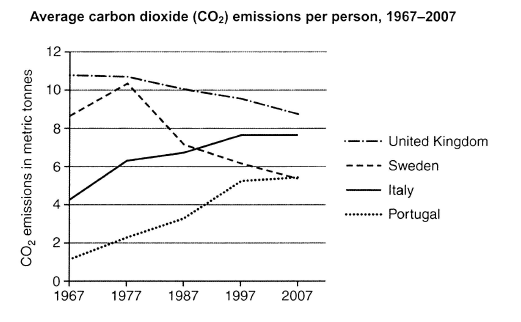
The graph below shows average carbon dioxide (CO2) emissions per person in the United Kingdom, Sweden, Italy and Portugal between 1967 and 2007.
Summarise the information by selecting and reporting the main features, and make comparisons where relevant.
Student answer (Band 4.0)
the graph shows average carbon dioxide emissiona per person in the united kingdom sweden italy and portugal between 1967 and 2007.united kingdum had a bit large population rether than other countries like seweden ,italy and portugal when popoualtion increace definatly there oxygen intake increace due to increace in popouation so carbon emission level also high other countries like sewden had less popolation people intake less oxygen so carbon emission definatly low.
in this graph sewden and united kingdom in 1977 carbon emission ratio will be same on the other hand portugal and italy have less carbon emission due to low population .
in 2007 sewden and portugal had a same ratio but on he other hand italy and united kingdom had a different ratio italy had 7.5 percent ratio of carbon emission .
rether than united kingdom .
united kingdom in 2007 decreace emission of carbon it decreace 11.5 to 8.5 .
AI examiner evaluation
| Criterion | Band |
|---|---|
| Task Achievement / Task Response | 3.0 |
| Coherence and Cohesion | 3.5 |
| Lexical Resource | 4.5 |
| Grammatical Range and Accuracy | 4.5 |
| Overall | 4.0 |
Task Achievement / Task Response: Band 3.0
The response identifies the countries and period, and it notices that the UK’s emissions fell and that Sweden and Portugal had similar figures in 2007. However, it does not provide a clear, accurate overview of the main trends, and several comparisons are incorrect: in 1977 Sweden was slightly below the UK, not at the same level, while Italy and Portugal were not both lower than the other countries. The explanation about population and oxygen intake is unsupported by the graph and distracts from reporting its data. The UK’s figures are also misreported as falling from 11.5 to 8.5, rather than approximately 10.8 to 8.7. The response is 139 words, below the required 150. To improve, summarise the overall patterns and select accurate comparisons from the graph.
Coherence and Cohesion: Band 3.5
There is a basic attempt to organise the response by introducing the graph and then referring to 1977 and 2007. Some linking phrases, such as “on the other hand,” show an effort to connect comparisons. However, the ideas do not progress clearly: the population explanation interrupts the description of the data, and the final statement about the UK is separated into a fragment. References such as “same ratio” and “different ratio” are unclear, and the paragraphing does not distinguish an overview from supporting details. A clearer sequence would be an introduction, a concise overview of the main trends, and then paragraphs comparing the countries across the period. Use linking words only where the relationship between the figures is clear.
Lexical Resource: Band 4.5
The response uses some relevant topic vocabulary, including “carbon emission,” “ratio,” and “decrease,” so the reader can recognise that it concerns emissions over time. However, the range is limited and several choices are inaccurate or repetitive. “Ratio” is not suitable for describing the amount of emissions; use “level” or “figure.” The repeated phrase “carbon emission” would be more precise as “CO₂ emissions.” There are also frequent spelling errors, including “united kingdum,” “popoualtion,” and “decreace,” which reduce clarity and control. Some phrases, such as “oxygen intake,” do not accurately describe the information shown. Build a small set of precise terms for describing quantities and trends, and check spelling before submitting.
Grammatical Range and Accuracy: Band 4.5
The response attempts to form longer sentences using connectors such as “when” and “on the other hand,” and it includes simple statements about changes over time. However, sentence structures are often incomplete or difficult to follow. For example, “in 2007 sewden and portugal had a same ratio” lacks accurate article use, while “rether than united kingdom” is a fragment rather than a complete sentence. Verb forms and agreement are also unreliable, as in “population increace” and “it decreace 11.5 to 8.5.” Capitalisation and punctuation are inconsistent, with several sentences running together. Practise writing complete subject–verb sentences, using past-tense forms consistently for the historical data, and separating each comparison with clear punctuation.
See this exact question answered at other band scores. The same prompt compared across bands.
Browse more IELTS Writing model answers or get your own writing scored by the same AI examiner.