Band 5.5 IELTS Writing Task 1 Model Answer
Overall Band Score: 5.5 · Cambridge IELTS 11 · 2026-11-06
IELTS Writing Task 1 question
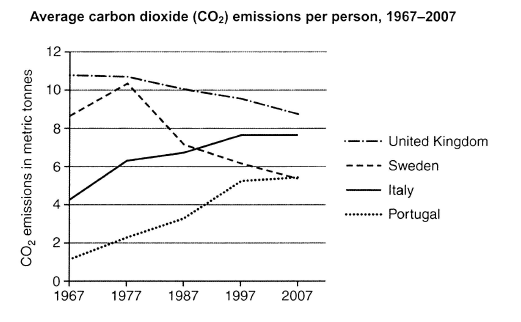
The graph below shows average carbon dioxide (CO2) emissions per person in the United Kingdom, Sweden, Italy and Portugal between 1967 and 2007.
Summarise the information by selecting and reporting the main features, and make comparisons where relevant.
Student answer (Band 5.5)
The chart demonstrate the information about individuals people of carbon dioxide emissions from 1967 to 2007.
overall, begainning of that chart in 1967 united kingdom was the peak level its almost 11 metric tone carbon dioxide released, sweden,also in 2nd higest level. italy and portugal were the low acrbon dioxode relased country.
There were 4 country in the graph, 1st two country which is united kingdom and sweden they were most carbon dioxide relased country in 1967 and the amount was 11 metric tone for UK and almost 9 matric tone for sweden.In 1977 sweden touch the level of UK which is almost 10 metric tone . but after the 1987 to 2007 their amount of carbon dioxide emisson falldown and the amount was almost 8 metric tone both of the country.
when the graph talk about italy and portugal they ar oposite of other countries they were too low about emission per person carbon dioxide that was almost 1 metric tone for portugal and 4 metric tone for italy which were too low than other countires. but day after day it has been increased slowly .
in 1997 portugal were peak level of his history that is approximatly 5 metric tone carbon dioxide per person and then it freeze the amount from 1997 to 2007.after that italy also increasing year after year from 1977 to 2007.
in conclusion the four country of the graph they all are relesed carbon dioxide and thats was increasing year after year in the end at 2007 almost four countrys emmison level per person was almost same.
AI examiner evaluation
| Criterion | Band |
|---|---|
| Task Achievement / Task Response | 5.5 |
| Coherence and Cohesion | 5.5 |
| Lexical Resource | 5.0 |
| Grammatical Range and Accuracy | 5.0 |
| Overall | 5.5 |
Task Achievement / Task Response: Band 5.5
You identify the main groups and several broad trends: the UK starts highest and declines, Sweden rises before falling, and Italy and Portugal increase. However, some key comparisons are inaccurate or too general. The UK and Sweden do not finish at “almost 8 metric tone both”: in 2007 they are about 8.7 and 5.4 tonnes respectively. The conclusion that all four countries’ levels were “almost same” is also misleading; the figures still range from about 5.4 to 8.7. Italy’s rise is not described precisely, and its level stabilises at around 7.6 from 1997 to 2007. A clearer overview and more accurate end-point comparisons would make the summary more complete and reliable.
Coherence and Cohesion: Band 5.5
The response has an identifiable structure, moving from an opening statement to an overview, country details and a conclusion. Grouping the UK and Sweden together, then Italy and Portugal, is a useful way to organise the information. However, progression is weakened by repeated or unclear transitions such as “after that” and “day after day,” and some references are difficult to follow, including “their amount” and “it freeze the amount.” The final conclusion repeats a broad claim rather than drawing together the actual differences. Use clearer topic sentences and link each paragraph to a distinct comparison, while choosing precise references such as naming the country instead of using “it” or “they.”
Lexical Resource: Band 5.0
You use some relevant chart vocabulary, including “emissions,” “per person,” “increased,” and “metric tone,” so the reader can generally identify the topic and direction of change. However, the range is limited and several word choices or spellings make the account less clear, for example “peak level,” “touch the level,” “it freeze,” and repeated forms of “released.” There are also frequent spelling errors such as “acrb(on),” “dioxode,” “approximatly,” and “emmison.” Aim for accurate, natural collocations used in data descriptions, such as “reached a peak,” “rose to,” “declined,” and “remained stable.” Check spelling and avoid repeating the same basic terms.
Grammatical Range and Accuracy: Band 5.0
You attempt both simple and longer sentences, including comparisons and time clauses, but control is inconsistent. Errors occur frequently in sentence structure, verb forms, agreement, articles and punctuation. For example, “The chart demonstrate” has subject–verb disagreement, while “in 1977 sweden touch” needs a past-tense verb; “There were 4 country” also has an incorrect plural form. Several sentences run together or lack clear punctuation, particularly the long sentence beginning “There were 4 country in the graph.” These errors sometimes make relationships between figures difficult to understand. Practise accurate past-tense reporting and build longer sentences from correctly punctuated clauses, checking agreement and articles as you edit.
See this exact question answered at other band scores. The same prompt compared across bands.
Browse more IELTS Writing model answers or get your own writing scored by the same AI examiner.