Band 5.5 IELTS Writing Task 1 Model Answer
Overall Band Score: 5.5 · Cambridge IELTS 11 · 2026-11-06
IELTS Writing Task 1 question
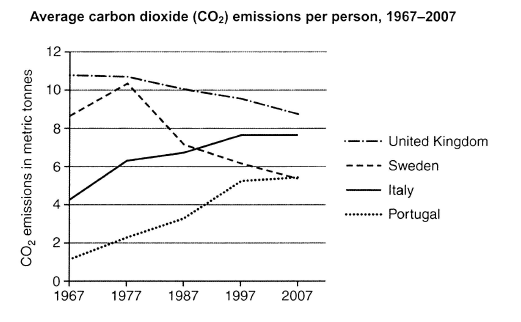
The graph below shows average carbon dioxide (CO2) emissions per person in the United Kingdom, Sweden, Italy and Portugal between 1967 and 2007.
Summarise the information by selecting and reporting the main features, and make comparisons where relevant.
Student answer (Band 5.5)
The graph demonstrate average carbon dioxide emissions per person including four countries: United Kingdom, Sweden, Italy and Portugal from 1967 to 2007.
Overall, Sweden's carbon dioxide emissions per person reached at the peek in 1977 almost 11. Portugal gradually increased this number from 1967 to 2007. On the other hand, United Kingdom's carbon dioxide emissions decreased per year.
Emissions of carbon dioxide of United Kingdom was really high in 1967, which is almost 11. Later, the emissons fall every single year and in the end in 2007 it was approximately 7. Sweden, on the other hand, start with 7 metric tonnes, suddenly the number reached almost 11 in 1977. Though, Sweden's emissions gradually decreased over the years between 1887 and 2007.
In 1967, Italy start with approximately 5 metric tonnes but the carbon dioxide emissions increased every year. Likewise Portugal's carbon dioxide emissions was very low, but the figure increased significantly between 1967 and 2007.
AI examiner evaluation
| Criterion | Band |
|---|---|
| Task Achievement / Task Response | 5.5 |
| Coherence and Cohesion | 5.5 |
| Lexical Resource | 5.5 |
| Grammatical Range and Accuracy | 5.5 |
| Overall | 5.5 |
Task Achievement / Task Response: Band 5.5
You identify the four countries and report several central trends: UK emissions decline, Sweden peaks in 1977 and then falls, while Italy and Portugal rise. However, some key details are inaccurate or too general. The UK ends at about 8.7 tonnes, not approximately 7, and Sweden begins at about 8.6, not 7. The stated period “1887” is also incorrect. Italy levels off at around 7.6 in the final decade, rather than increasing every year, and Portugal’s rise could be supported with figures. The overview mentions trends but does not clearly compare the countries’ overall positions, such as the UK remaining highest and Portugal catching up with Sweden by 2007. More accurate and selective comparisons would make the summary more complete.
Coherence and Cohesion: Band 5.5
The response has a recognisable structure, with an introduction, an overview and separate paragraphs describing the countries. Linking phrases such as “On the other hand,” “Likewise” and “Though” show an attempt to connect ideas. However, progression is limited because the body mostly lists individual trends rather than grouping or comparing related data. Some connections are also awkward or unclear: “Portugal gradually increased this number” does not clearly identify what “this number” refers to, and “Though” introduces a sentence without a clear contrast. The repeated country-by-country pattern and repeated use of “carbon dioxide emissions” make the account feel mechanical. Organise the details around comparisons—for example, the two declining series and the two rising series—and use clear references to improve flow.
Lexical Resource: Band 5.5
You use relevant vocabulary for describing a line graph, including “gradually increased,” “decreased,” “reached” and “metric tonnes,” so the main trends are generally understandable. However, the range is limited and some word choices or collocations are inaccurate. “Reached at the peek” is not a natural way to describe a high point; “peaked” would be appropriate. “Increased this number” is vague, while “emissions fall every single year” is imprecise and overly conversational. There are also spelling errors, including “emissons,” and repeated use of “carbon dioxide emissions” where “the figure” or “the level” could avoid repetition. Aim for precise trend language and check spelling and collocations when editing.
Grammatical Range and Accuracy: Band 5.5
You attempt a mixture of simple and more complex sentences, including clauses with “which” and contrast markers such as “on the other hand.” Meaning is usually recoverable, but errors in agreement, tense and sentence construction occur across the response. For example, “The graph demonstrate” needs subject–verb agreement, and “United Kingdom’s … was” should agree with the plural noun “emissions.” Past-tense reporting is inconsistent in “Sweden … start” and “Italy start,” while “Sweden’s emissions … decreased … between 1887 and 2007” contains an incorrect date. The construction “reached at the peek” is also grammatically faulty. Review past-tense forms and singular/plural agreement, and build complex sentences carefully so that each clause is complete and accurate.
See this exact question answered at other band scores. The same prompt compared across bands.
Browse more IELTS Writing model answers or get your own writing scored by the same AI examiner.