Band 5.5 IELTS Writing Task 1 Model Answer
Overall Band Score: 5.5 · Cambridge IELTS 11 · 2026-11-08
IELTS Writing Task 1 question
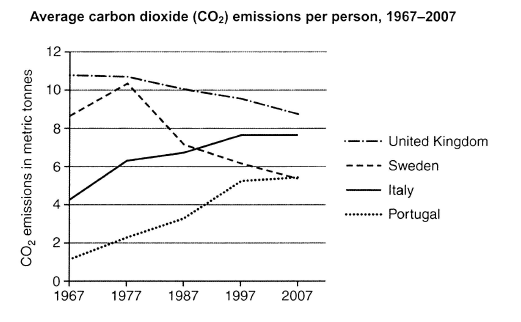
The graph below shows average carbon dioxide (CO2) emissions per person in the United Kingdom, Sweden, Italy and Portugal between 1967 and 2007.
Summarise the information by selecting and reporting the main features, and make comparisons where relevant.
Student answer (Band 5.5)
The line graph illustrates emissions of carbon dioxide caused per person in 4 different countries (Uk, Sweden, Italy and Portugal) in from 1967 to 2007.
Overall, the amount carbon emission was highest among United Kingdom or Sweden. However, the amount emission among Purtgal and Italy was least at begining. Although, digits of carbon emission shows fluctation.
To begin with, carbon emission produced by British was approximately 11 metric tonnes, in 1967. Which showed a slight decline to 9 tonnes in 2007. In term of Sweden, the amount of carbon emission around 9 metric tonnes, in 1967. which went up to 10 metric tonnes, in 1977, before decling to 5 metric tonnes in 2007. In case of Italy the digit of carbon emission was approximately 5 mertic tonnes in 1967. After that it depict a sudden increase to 8 metric tonnes in 2007. Last but not least, Portugal made only 1 mertic ton of carbon emission, in 1967. The amount of emission was increased sharply during the period and reached to 5 metric tonnes, in 2007.
AI examiner evaluation
| Criterion | Band |
|---|---|
| Task Achievement / Task Response | 5.5 |
| Coherence and Cohesion | 6.0 |
| Lexical Resource | 5.5 |
| Grammatical Range and Accuracy | 5.0 |
| Overall | 5.5 |
Task Achievement / Task Response: Band 5.5
You identify the four countries and cover the full period, with relevant figures for each series. The main trends are partly captured: the UK and Sweden decline overall, while Italy and Portugal rise, and your account of Sweden’s peak in 1977 is accurate. However, the overview is unclear and does not bring out the key comparisons: the UK remained highest by 2007, Italy rose to second place, and Portugal and Sweden ended at roughly the same level. Saying emissions were highest in the UK “or Sweden” is imprecise, and describing Italy and Portugal as the least-emitting countries only applies at the beginning. Some figures are also too approximate or inaccurate, such as Italy’s 1967 level and its 2007 endpoint. A clearer overview and more precise comparisons would strengthen the report.
Coherence and Cohesion: Band 6.0
The response has a recognisable structure: an introduction, an overview, and a paragraph that reports the countries in turn. Sequencing phrases such as “To begin with,” “In term of Sweden,” and “Last but not least” help signal movement between series. However, the progression is somewhat mechanical, and the overview does not clearly prepare the reader for the comparisons that follow. Some links are faulty or unclear, particularly “Overall, the amount carbon emission was highest among United Kingdom or Sweden,” where the relationship between the countries is not expressed clearly. Sentence fragments after full stops, such as “Which showed a slight decline,” also interrupt the flow. Grouping the rising countries together and the declining countries together would make the comparisons more coherent.
Lexical Resource: Band 5.5
You use relevant topic vocabulary, including “metric tonnes,” “decline,” “increase,” and “fluctuation,” so the subject is generally understandable. There is some attempt to vary wording, for example “went up,” “declining,” and “reached.” However, the range is limited and several word choices or collocations are inaccurate, including “amount carbon emission,” “digits of carbon emission,” and “made only 1 metric ton of carbon emission.” Spelling errors such as “Purtgal,” “begining,” “decling,” and “mertic” are noticeable and reduce precision. Aim for standard chart-reporting phrases such as “emissions per person stood at” and “rose to,” and check spelling carefully. More accurate, varied vocabulary would help you describe trends and comparisons clearly.
Grammatical Range and Accuracy: Band 5.0
You attempt both simple and more complex sentence forms, including a contrast with “before” and a clause beginning “Although.” However, control is inconsistent, and several sentences contain errors that make the relationships between ideas difficult to follow. For example, “The amount carbon emission was highest” is missing a grammatical link, while “Which showed a slight decline” is a sentence fragment. Capitalisation after full stops is also inconsistent, as in “which went up.” There are problems with articles, prepositions, and sentence construction in phrases such as “in from 1967 to 2007” and “reached to 5 metric tonnes.” Practise complete sentences and accurate clause linking, while checking articles and prepositions in common reporting patterns.
See this exact question answered at other band scores. The same prompt compared across bands.
Browse more IELTS Writing model answers or get your own writing scored by the same AI examiner.