Band 5.0 IELTS Writing Task 1 Model Answer
Overall Band Score: 5.0 · Cambridge IELTS 11 · 2026-11-08
IELTS Writing Task 1 question
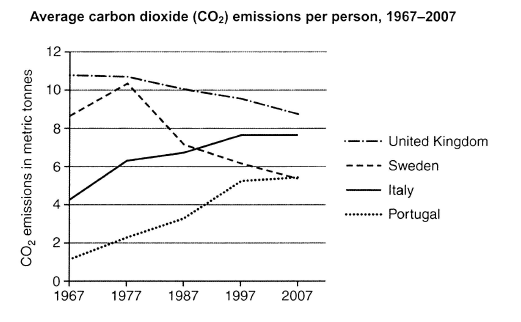
The graph below shows average carbon dioxide (CO2) emissions per person in the United Kingdom, Sweden, Italy and Portugal between 1967 and 2007.
Summarise the information by selecting and reporting the main features, and make comparisons where relevant.
Student answer (Band 5.0)
The line graph illustrates the average carbon dioxide emission per person in the Unites kingdom ,Swiden , Italy and Portugal between 1967 and 2007.
From the graph we can see that the emission of the carbon dioxide in United kingdom was at it's peak in 1967. Besides, in Portugal the percentange was at low and it's under 2%.Additionally , Sweden was in the secound place .After 10 years , we see a noticable change of percentange in Italy and Sweden. Sweden was at the peak as United Kingdom. On the otherside , United kingdom's percentange remained stable.Italy reached above 6% in this same year. However, in Portugal carbon dioxide emission increased a little.In the next 10 years, the percentange of the emission in Sweden decreased dramatically . Additionally, United kingdom's percentange started to fall rapidly. Besides, in Italy and portugal started to rise rapidly . After 20 years , in 2007, the percentange in United kingdom declined also in Sweden. However, in Italy and Portugal increased in 1997. After all it remained steady during the years between 1997 to 2007
Analyzing the line graph we can certainlly understand that the graph fluctuated most of the time. However , there was a few time that the graph remained stable .
AI examiner evaluation
| Criterion | Band |
|---|---|
| Task Achievement / Task Response | 4.5 |
| Coherence and Cohesion | 4.5 |
| Lexical Resource | 5.0 |
| Grammatical Range and Accuracy | 5.0 |
| Overall | 5.0 |
Task Achievement / Task Response: Band 4.5
You identify the countries and time period, and you notice several genuine patterns, including the UK’s overall decline, Sweden’s fall after its 1977 high, and increases in Italy and Portugal. However, the response reports these features imprecisely and sometimes inaccurately: the UK was not at its peak only in 1967, as it was slightly higher than the other years but changed little by 1977; Italy and Portugal did not both increase after 1997, since Italy stayed level at about 7.6 tonnes while Portugal rose slightly. The overview that emissions “fluctuated most of the time” is too general and does not capture the main contrasts. Focus on tonnes rather than percentages and summarise the overall ranking and contrasting trends accurately.
Coherence and Cohesion: Band 4.5
The response has an opening, a chronological account, and a concluding statement, so there is some attempt to organise the information. However, the main body moves between countries and years without a clear, consistent structure, and the sequence becomes difficult to follow—for example, “After 20 years, in 2007” is followed by a claim about increases “in 1997.” Linking phrases such as “Besides,” “Additionally,” and “However” are frequent but do not always show a clear relationship between the points. The final paragraph repeats a broad observation rather than providing a useful overview. Group the information by trend or compare countries at key dates, and use fewer, more precise transitions and clearer references.
Lexical Resource: Band 5.0
You use some relevant vocabulary for describing a graph, including “remained stable,” “decreased dramatically,” “declined,” and “increased.” This gives you a basic range for reporting change. However, several choices are inaccurate or repetitive: “percentage” is unsuitable because the graph measures emissions in metric tonnes, and “peak” is used where a precise description of the value or trend would be clearer. Spelling errors such as “Unites,” “Swiden,” “secound,” and “certainlly” are noticeable, while repeated use of “percentange” and “emission” limits variety. Use standard graph language such as “figure,” “level,” and “tonnes per person,” and check country names and spelling carefully.
Grammatical Range and Accuracy: Band 5.0
You attempt a mixture of simple and longer sentences, including clauses introduced by “However” and “After.” Nevertheless, errors occur frequently and sometimes make relationships between ideas unclear. Examples include “the emission … was at it's peak,” “in Italy and portugal started to rise,” and “there was a few time,” which show problems with sentence construction, agreement, and verb forms. Punctuation and spacing are also inconsistent, as in “2%.Additionally” and “However ,”. Practise building complete sentences with a clear subject and verb, and check agreement and tense—for example, “emissions in Italy and Portugal rose” and “there were a few periods.” More accurate control of these basic patterns would make your comparisons easier to understand.
See this exact question answered at other band scores. The same prompt compared across bands.
Browse more IELTS Writing model answers or get your own writing scored by the same AI examiner.