Band 6.0 IELTS Writing Task 1 Model Answer
Overall Band Score: 6.0 · Cambridge IELTS 11 · 2026-11-08
IELTS Writing Task 1 question
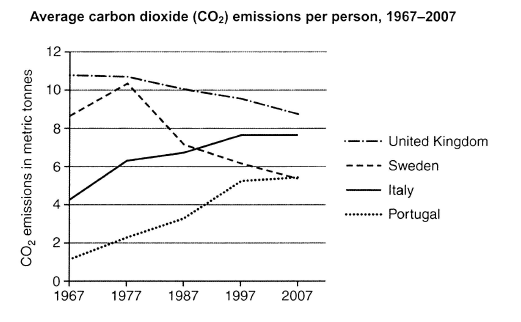
The graph below shows average carbon dioxide (CO2) emissions per person in the United Kingdom, Sweden, Italy and Portugal between 1967 and 2007.
Summarise the information by selecting and reporting the main features, and make comparisons where relevant.
Student answer (Band 6.0)
The illustration gives information about the average carbon dioxide emission per person in UK between 1967 and 2007. Overall, in case of United kingdom and Sweden pollution decreased with the passage of time.In contrast Italy and Portugal carbon emission increased and touch its higher level. The most interesting figure showed in case of Sweden in which dramatically rose and fall of carbon emission.
It is quite evident from the line graph that showed relationship between carbon dioxide emission in metric tonness and years. From the given graph we say that in United Kingdom had the highest carbon emission almost 11 tonnes in 1967. After that started decreasing gradually and finally reached 8.3 tonnes in 2007. In contrast, Portugal was the country in which pollution was low and it was less than 2 tonnes in 1967. Subsequently it dramatically increased and toch the figure of 4.6 tonnes in 1997 and then remained constant until 2007.
Furthermore, in case of Italy carbon emission was 4.1 tonnes and then rose randomly and touch the figure 6.1 in 1977 followed by 6.9 tonnes in 1997. After that it remained constant until 2007. In contast, Sweden was the only country which showed dramatic rose and decline of carbon emission and finally its pollution became equal to Portugal in 2007.
AI examiner evaluation
| Criterion | Band |
|---|---|
| Task Achievement / Task Response | 6.5 |
| Coherence and Cohesion | 6.0 |
| Lexical Resource | 5.5 |
| Grammatical Range and Accuracy | 5.5 |
| Overall | 6.0 |
Task Achievement / Task Response: Band 6.5
You identify the broad pattern accurately: emissions fall in the UK and Sweden overall, while Italy and Portugal rise, and you note Sweden’s marked rise and fall. You also include relevant country comparisons, such as the UK starting highest and Portugal starting lowest, and correctly observe that Sweden and Portugal finish at similar levels. This gives the report a clear overview and covers the main trends. However, several details are inaccurate or incomplete: the UK ends at about 8.7 tonnes, not 8.3; Portugal reaches about 5.2 in 1997, not 4.6; and Italy reaches about 7.6 by 1997, rather than 6.9. The account of Sweden would be stronger with its peak in 1977 and subsequent decline quantified. More precise reporting would complete the otherwise relevant summary.
Coherence and Cohesion: Band 6.0
The response has a recognisable structure: an opening overview followed by paragraphs describing the countries, and the information is generally grouped in a sensible way. Linking expressions such as “In contrast,” “After that,” and “Furthermore” help signal comparisons and sequence. However, cohesion is sometimes mechanical, with repeated transitions and repeated references to “carbon emission.” Some sentence connections are also unclear, particularly “The most interesting figure showed in case of Sweden in which dramatically rose and fall,” where the relationship between the idea and the graph is difficult to follow. The second paragraph moves between countries without a consistent grouping, and the final Sweden comparison is added abruptly. Organising the details into clearer groups—declining countries and rising countries—and using more precise referencing would improve progression.
Lexical Resource: Band 5.5
You use a relevant range of topic vocabulary, including “average,” “gradually,” “dramatically,” “decline,” and “remained constant,” so the main trends are usually understandable. There are also attempts to vary wording through “emission,” “pollution,” and “carbon emission.” However, some choices are inaccurate or unnatural for describing a graph: “touch its higher level,” “rose randomly,” and “pollution became equal to Portugal” do not express the intended comparisons precisely. Repetition of “carbon emission” also limits flexibility. Spelling errors such as “tonness,” “toch,” and “contast” are noticeable, while “metric tonnes” is the appropriate unit phrase. Aim for accurate trend collocations such as “reached a peak,” “increased steadily,” and “fell to,” and check spelling before submitting.
Grammatical Range and Accuracy: Band 5.5
You attempt both simple and more complex sentences, including contrast clauses and time sequences, and the overall meaning can usually be followed. However, some sentence structures are incomplete or awkward, for example, “After that started decreasing gradually” lacks a clear subject, and “The most interesting figure showed in case of Sweden in which dramatically rose and fall” does not form a complete, controlled clause. There are also errors in articles, agreement, and verb forms, as in “in United Kingdom had the highest” and “Italy and Portugal carbon emission increased and touch its higher level.” Punctuation spacing is inconsistent, and several sentences run together without clean boundaries. Use a clear subject and finite verb in each clause, and check tense and agreement when describing past data.
See this exact question answered at other band scores. The same prompt compared across bands.
Browse more IELTS Writing model answers or get your own writing scored by the same AI examiner.