Band 5.0 IELTS Writing Task 1 Model Answer
Overall Band Score: 5.0 · Cambridge IELTS 11 · 2026-11-07
IELTS Writing Task 1 question
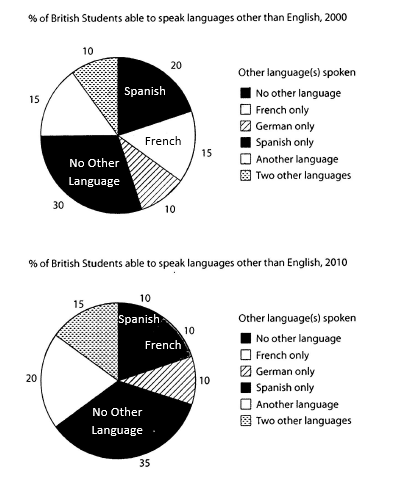
The charts below show the proportions of British students at one university in England who were able to speak other languages in addition to English, in 2000 and 2010
Summarise the information by selecting and reporting the main features, and make comparisons where relevant.
Student answer (Band 5.0)
The Two pie chart shows the share of British student at one of the university in England who are able to speak other languages other then English From the year 2000 and 2010. Its a great achievement for some to speak other languages then English as a British student.
If we compare the both charts and illustrate the percentage of student who cant speak other languages in 2000 it was 30 percent which increase to 35 percent in 2010 which is a massive change. If we check upon the the two other languages its increase from 10 to 15 percent in 2010. Spanish and French are one of the most beautiful languages and if we compare them in combine there were 35 percent student who can speak these languages in 2000 but in 2010 the percentage for these languages is 20 percent ,10 for each.
In my opinion the university should have different languages courses so the students can get more information and exposure about other languages and communities.
AI examiner evaluation
| Criterion | Band |
|---|---|
| Task Achievement / Task Response | 5.0 |
| Coherence and Cohesion | 5.5 |
| Lexical Resource | 5.0 |
| Grammatical Range and Accuracy | 5.0 |
| Overall | 5.0 |
Task Achievement / Task Response: Band 5.0
You identify several relevant figures, including the rise in students speaking two other languages from 10% to 15%, and the increase in those speaking no other language from 30% to 35%. You also correctly note that Spanish and French together fell from 35% to 20%. However, the response only partially summarises the charts: it gives no clear overall overview of the main pattern, and it omits important comparisons such as the increase for “another language” from 15% to 20% and the unchanged German-only figure. The final recommendation about university courses is not requested and takes space from reporting the data. Focus on the key trends and compare the categories directly, without adding personal opinion.
Coherence and Cohesion: Band 5.5
There is some basic organisation: an opening identifies the charts, followed by comparisons and a concluding comment. The response also uses linking phrases such as “If we compare” and “but.” However, progression is limited because the data are presented in a single long body paragraph, and the final opinion shifts away from the chart summary. Some connections are unclear or repetitive, particularly “If we compare the both charts” followed by “If we check upon the the two other languages.” Group the information into a clear overview and a paragraph comparing the main changes, and use references such as “this proportion” or “by contrast” to make relationships between figures easier to follow.
Lexical Resource: Band 5.0
The vocabulary is sufficient to communicate the main categories and changes, with useful terms such as “percentage,” “increase,” and “compare.” However, the range is limited and several choices are informal, imprecise, or repetitive. “Massive change” overstates a five-percentage-point rise, while “beautiful languages” is subjective and irrelevant to an academic chart description. Phrases such as “check upon” and “in combine” are not natural collocations, and “student” is repeatedly used where the plural is needed. Choose neutral, precise language for describing data, and use verbs such as “rose,” “declined,” and “remained stable” to vary your reporting. Careful spelling and word-form checking would also improve clarity.
Grammatical Range and Accuracy: Band 5.0
The response attempts some longer sentences, including a comparison of the combined Spanish and French figures, but grammatical control is inconsistent and the range remains limited. Errors occur in sentence structure, agreement, articles, and punctuation. For example, “The Two pie chart shows” has incorrect agreement and capitalisation, while “the percentage of student who cant speak” contains agreement and apostrophe problems. The opening sentence also lacks a full stop, and the sentence beginning “Spanish and French…” becomes difficult to follow as several ideas are joined together. Practise accurate simple sentences first, then build comparisons with controlled clauses, for example: “The proportion speaking no other language rose from 30% to 35%.”
See this exact question answered at other band scores. The same prompt compared across bands.
Browse more IELTS Writing model answers or get your own writing scored by the same AI examiner.