Band 5.5 IELTS Writing Task 1 Model Answer
Overall Band Score: 5.5 · Cambridge IELTS 11 · 2026-11-08
IELTS Writing Task 1 question
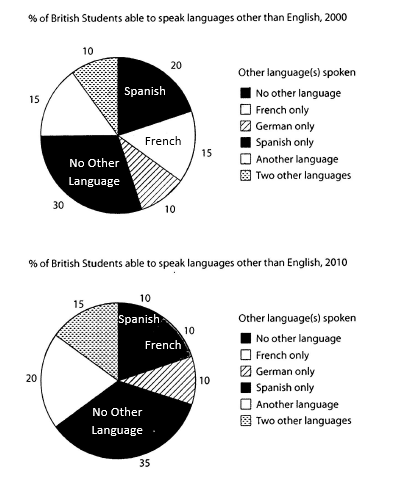
The charts below show the proportions of British students at one university in England who were able to speak other languages in addition to English, in 2000 and 2010
Summarise the information by selecting and reporting the main features, and make comparisons where relevant.
Student answer (Band 5.5)
The pie charts below demonstrates the percentage of British students who are able to speak other language rather than English between 2000 and 2010 at one University in England.
Overall, over the decade, most of the students equally speak Spanish, French and German, their numbers didn’t increase that much in no other language and another language parts. The spanish speaking students number decreases significantly.
In 2000, the proportions of no other language section is the highest at 30%. Two other languages and German only language speaking students are lower in that university at 10% only. Spanish speaking students number was the second highest in this year.
In 2010, no other language speaking british students slightly Increase at 35% and became the highest in this year. The British students who speaks Spanish and French proportions marginally fall around at 10%. In addition, two sections of this part, another language and two other language by 5% over the decade.
AI examiner evaluation
| Criterion | Band |
|---|---|
| Task Achievement / Task Response | 5.5 |
| Coherence and Cohesion | 6.0 |
| Lexical Resource | 5.5 |
| Grammatical Range and Accuracy | 5.0 |
| Overall | 5.5 |
Task Achievement / Task Response: Band 5.5
You identify the main overall pattern that students speaking no other language formed the largest group, rising from 30% to 35%, and you note the decline in Spanish. These are relevant comparisons. However, the overview is unclear and includes an inaccurate claim that Spanish, French and German were spoken in equal proportions; the figures do not support this, especially in 2000. Some details are also imprecise: Spanish fell from 20% to 10%, while French fell from 15% to 10%, so describing both as falling by around the same amount obscures the comparison. You mention the increases in “another language” and “two other languages” but do not give their starting and ending values. A clearer overview and more accurate, selectively reported figures would strengthen coverage of the charts.
Coherence and Cohesion: Band 6.0
The response has a clear four-paragraph structure: an introduction, an overview, and separate descriptions of the two years. This gives the reader a generally coherent route through the information, and phrases such as “In 2000” and “In 2010” help signal the time sequence. However, the overview does not clearly organise the main comparisons, and some references are difficult to follow, particularly “their numbers” and “two sections of this part.” The final sentence also says the categories changed “by 5%” without clearly stating whether this means a five-percentage-point rise. To improve, group the categories that increased, decreased, or stayed constant, and use precise references to each category rather than relying on “this part.”
Lexical Resource: Band 5.5
You use some relevant chart vocabulary, including “proportions,” “percentage,” “decreases significantly,” and “highest,” so the reader can understand the general subject and direction of change. However, the range is limited and several word choices or collocations are inaccurate, such as “speak other language,” “students number,” and “fall around at 10%.” Repetition of “students” and “language” also makes the description less precise. There are spelling and capitalisation slips, including “spanish,” “british,” and “Increase.” Aim for natural chart-reporting phrases and accurate category labels, for example “the proportion of students speaking Spanish” and “rose by five percentage points.”
Grammatical Range and Accuracy: Band 5.0
The response attempts both simple and more developed sentence forms, including “In 2010, no other language speaking British students slightly Increase at 35% and became the highest in this year.” However, errors in agreement, articles, plurals, and verb forms are frequent enough to make some sentences awkward or unclear. For example, “The pie charts below demonstrates” should use a plural verb, while “the proportions … is the highest” has a subject–verb agreement problem. “The British students who speaks” also needs a plural verb, and “their numbers didn’t increase” shifts into an unsuitable past-tense construction for the overview. Practise checking each sentence’s subject and verb, and use consistent past tense when describing the chart years.
See this exact question answered at other band scores. The same prompt compared across bands.
Browse more IELTS Writing model answers or get your own writing scored by the same AI examiner.