Band 5.0 IELTS Writing Task 1 Model Answer
Overall Band Score: 5.0 · Cambridge IELTS 11 · 2026-11-08
IELTS Writing Task 1 question
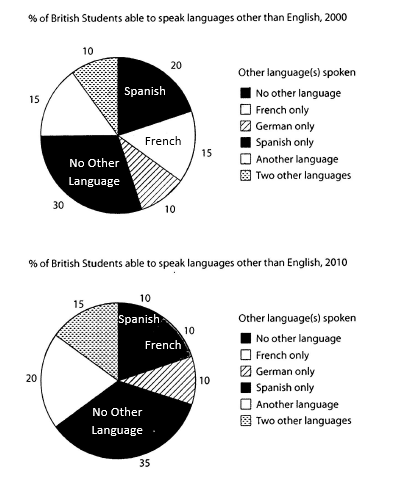
The charts below show the proportions of British students at one university in England who were able to speak other languages in addition to English, in 2000 and 2010
Summarise the information by selecting and reporting the main features, and make comparisons where relevant.
Student answer (Band 5.0)
The bellow pie charts illustrate the ratio of british learners at one instute in england who are multi langual in addition to english in the periods of 2000 and 2010.
Overall, not multilangual hold high ratio in both periods while, spanish were on the second. Germon language showed lowest interest by british students .
In 2000, 30% students had not interested in other languages. French were speak by 15% british students and spanish was spoken by 20% in 2000. similarly, Germon and two other languages were spoken by 10% respectively. 15% british were speaking another languages.
In 2010, No other language had a highest proportion of 35%, Another languages were speaking by 20% of students. 10% of british students were able to speak spanish, Germon only and French at the same time. Two othere languages have 15% bitish speakers.
AI examiner evaluation
| Criterion | Band |
|---|---|
| Task Achievement / Task Response | 4.5 |
| Coherence and Cohesion | 5.5 |
| Lexical Resource | 5.0 |
| Grammatical Range and Accuracy | 5.0 |
| Overall | 5.0 |
Task Achievement / Task Response: Band 4.5
You identify the two years and report several relevant figures, including the 30% and 35% with no other language, and the changes in Spanish and other languages. However, the overview is not fully accurate: Spanish was not the second-largest category in 2010, as “another language” reached 20% while Spanish fell to 10%. The claim that German showed the “lowest interest” is also misleading, since German was tied with two other categories in 2000 and with French and Spanish in 2010. The response is under the required 150 words, which limits the detail and development of the comparisons. Add a clearer overview and explain the main shifts between years.
Coherence and Cohesion: Band 5.5
The response has a basic, useful structure: an introduction, an overview, and separate paragraphs for 2000 and 2010. This makes the year-by-year information easy to locate. Some progression is present through phrases such as “In 2000” and “In 2010,” but the comparisons between the charts are mostly left implicit, and the overview does not accurately guide the reader through the main changes. Linking is also limited; “similarly” does not clearly show the relationship between the figures that follow. Improve the progression by grouping categories that rose, fell, or stayed unchanged, and use clear comparison links such as “by contrast” and “whereas.”
Lexical Resource: Band 5.0
You use some task-relevant vocabulary, including “proportion,” “spoken,” and “able to speak,” and the reader can generally identify the categories being discussed. However, the range is limited and several word choices or forms are inaccurate, sometimes making the meaning awkward: “ratio” is not the best term for chart percentages, while “not multilangual” and “lowest interest” do not describe the data precisely. Spelling errors such as “bellow,” “instute,” “Germon,” and “othere” are noticeable. Build a more accurate set of chart-reporting expressions and check spelling and word forms carefully; this will make the descriptions clearer and more natural.
Grammatical Range and Accuracy: Band 5.0
The response uses mostly simple sentence patterns, with a few attempts at more complex structures, but grammatical errors occur frequently. Examples include “French were speak by 15%” and “Another languages were speaking by 20%,” where the passive verb forms are incorrect. There are also problems with agreement and articles in “not multilangual hold high ratio” and “had a highest proportion.” Capitalisation and punctuation are inconsistent, including lowercase “british” and an unnecessary comma in the overview. These errors sometimes make the intended relationships harder to follow. Practise accurate passive forms for describing chart data, subject–verb agreement, and article use before adding more complex sentence structures.
See this exact question answered at other band scores. The same prompt compared across bands.
Browse more IELTS Writing model answers or get your own writing scored by the same AI examiner.