Band 4.5 IELTS Writing Task 1 Model Answer
Overall Band Score: 4.5 · Cambridge IELTS 11 · 2026-11-09
IELTS Writing Task 1 question
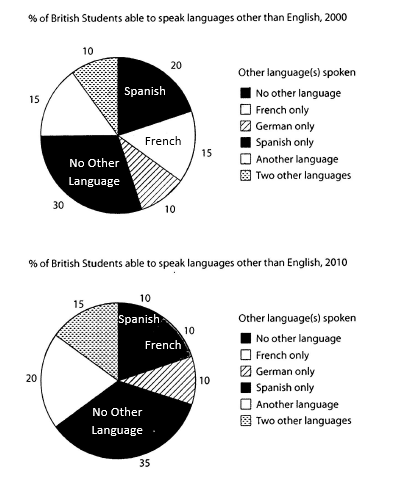
The charts below show the proportions of British students at one university in England who were able to speak other languages in addition to English, in 2000 and 2010
Summarise the information by selecting and reporting the main features, and make comparisons where relevant.
Student answer (Band 4.5)
THE GIVEN PIE CHARTS EXPLAINS THE PROPORTION OF BRITISH STUDENTS AT SINGLE UNIVERSITY IN ENGLAND.THEY WERE ABLE TO SPEAK IN MULTIPLE LANGUAGE IN ADATTION TO ENGLISH IN 2000 AND 2010.IN A GIVEN PIE CHART MAASIVE AREA WERE ACOPIED THATH STUDENT DO NOT SPEAK IN NO OTHER LANGUAGES LIKE 30%.MEAN WHILE THE FRENCH AND OTHER LAGUAGE HAD SAME PRPORTION THAT SPEAK IN ONE UNIVERSITY IN ENGLAND LIKE 15% EACH.AS WELL AS THE SPANIS IN ONE UNIVERSITY SPEAK 20% IN 2 000 TO 2010.THIS LANGUAGE IS MUCH SPOKEN IN UNIVERSITY IN ENGLAND.ALYHOUGH THE GERMAN IS IS SPEAK ONLY 10% AND TWO OTHER LANGUAGES WERE ALSO SPOKEN IN UNISVERSITY IN ENGLAND IN 2000 TO 2010.
IN SECOND GIVEN PIE CHART, INITIALLY THISE CHART IS ELABORATE THE NO OTHER LANGUAGE HAD A MASSIVE PROPORTION IS LIKE 35%.THE SECOND MUCH SPOKEN LANGUAGE IS FRENCH IS ABOUT 20%.AND TWO OTHER LANGUAGES IS SPOKEN ABOUT 15%.THE SAME RATIO LANGUAGES SPOKEN BY SPANISH AND FRENCH RATHER THAN ENGLISH IN 2010.
AI examiner evaluation
| Criterion | Band |
|---|---|
| Task Achievement / Task Response | 4.5 |
| Coherence and Cohesion | 5.0 |
| Lexical Resource | 4.5 |
| Grammatical Range and Accuracy | 4.5 |
| Overall | 4.5 |
Task Achievement / Task Response: Band 4.5
You identify several relevant categories and include some figures, such as 30% with no other language in 2000 and 35% in 2010, as well as 20% for Spanish in 2000. However, the account only partially reports the main features and contains important inaccuracies: French in 2010 is 10%, not “about 20%,” and Spanish falls to 10% in 2010 rather than remaining at 20%. The claim that Spanish was “much spoken” across both years also obscures this decline. There is no clear, accurate overview comparing the main changes, and some statements are difficult to interpret. To improve, summarise the overall pattern first, then compare the largest categories and the notable shifts using the chart’s figures accurately.
Coherence and Cohesion: Band 5.0
The response makes a basic attempt to separate the two years, beginning with “THE GIVEN PIE CHARTS” and then moving to “IN SECOND GIVEN PIE CHART.” This gives the reader a rough sense of the order of information. However, there is little overall progression within these sections: figures and categories are mentioned in a loose sequence, and several connections are unclear, as in “The same ratio languages spoken by Spanish and French rather than English in 2010.” Linking expressions such as “meanwhile,” “as well as,” and “although” are used, but do not consistently show the intended relationships. Organise the response into a clear introduction, an overview, and focused comparison paragraphs, grouping related figures and using precise references to the years and categories.
Lexical Resource: Band 4.5
You use some task-related vocabulary, including “proportion,” “language,” “spoken,” and “massive,” so the reader can recognise the general subject. However, the range is basic and repetitive, and frequent spelling errors—such as “adattition,” “maasive,” “prportion,” and “university”—make the text harder to read. Several expressions are also unnatural or imprecise, including “speak in multiple language,” “massive area were occupied,” and “the Spanish in one university speak 20%.” Choose standard chart-reporting phrases and accurate category names, for example, “accounted for,” “the proportion of students,” and “could speak another language.” Check spelling carefully and avoid repeating “in one university in England” when the chart context is already established.
Grammatical Range and Accuracy: Band 4.5
The response attempts to communicate comparisons and uses some linking clauses, but sentence structures are mostly simple or incomplete, and frequent grammatical errors sometimes obscure the intended meaning. For example, “The given pie charts explains” has subject–verb disagreement, while “They were able to speak in multiple language” has an unclear pronoun reference and incorrect singular/plural form. The sentence “Although the German is is speak only 10%” contains problems with verb form and clause construction. Articles, agreement, and punctuation are also inconsistently controlled, with long stretches joined by full stops or run together. Build accurate simple sentences first, then add controlled comparisons such as “The proportion speaking Spanish fell from 20% to 10%.”
See this exact question answered at other band scores. The same prompt compared across bands.
Browse more IELTS Writing model answers or get your own writing scored by the same AI examiner.