Band 6.0 IELTS Writing Task 1 Model Answer
Overall Band Score: 6.0 · Cambridge IELTS 11 · 2026-11-10
IELTS Writing Task 1 question
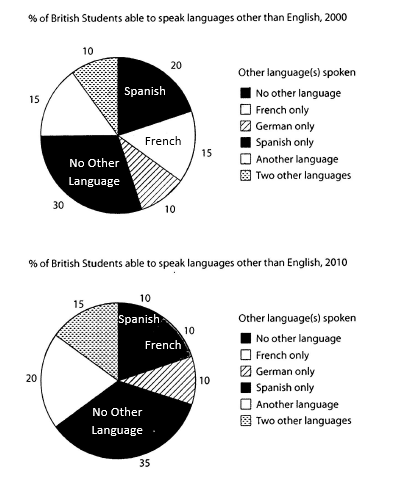
The charts below show the proportions of British students at one university in England who were able to speak other languages in addition to English, in 2000 and 2010
Summarise the information by selecting and reporting the main features, and make comparisons where relevant.
Student answer (Band 6.0)
The pie charts illustrates the percentage of British students at only one university from England who can speak a different language besides English, in 2000 and 2010.
Overall, the students who can not speak any other language in addition to English represents the biggest proportion for both years. In 2000 the lowest percentage accounted for the people who speak two other languages and German, while in 2010, Spanish, French and German were the least spoken languages.
Regarding the British students able to speak languages other than English in 2000, 30% of them do not know any other language, which is the highest percentage.
Comparing these two pie charts, the percentage of students who speak Spanish got lower, declining from 20% in 2000 to 10% in 2010. The same action happened to the proportion of French speakers, going from 15% to 10% in 2010. The proportions of students able to speak any other language went from 15% in 2000 to 20% in 2010. The proportions of British students able to speak two other languages incresed from 10% in 2000. to 15% in 2010
AI examiner evaluation
| Criterion | Band |
|---|---|
| Task Achievement / Task Response | 6.0 |
| Coherence and Cohesion | 6.0 |
| Lexical Resource | 6.0 |
| Grammatical Range and Accuracy | 6.0 |
| Overall | 6.0 |
Task Achievement / Task Response: Band 6.0
You identify the main overall feature accurately: students with no other language form the largest group in both years, rising from 30% to 35%. You also report several key changes correctly, including Spanish falling from 20% to 10%, French from 15% to 10%, and the “another language” and “two other languages” categories increasing. However, coverage is uneven: the 2000 figures receive a separate sentence, while the 2010 no-other-language figure and the unchanged German proportion are not clearly compared. The overview’s claim that German was among the least spoken in 2000 is accurate, but the comparison could be more complete. A fuller summary of the main shifts across all categories would make the report more developed.
Coherence and Cohesion: Band 6.0
The response has a clear overall arrangement: an introduction, an overview, and then details about the figures. Linking expressions such as “Overall,” “Regarding,” and “Comparing these two pie charts” help signal the stages of the report. The progression is generally understandable, but the detail section is not fully balanced: it first repeats the 2000 no-language figure, then moves to selected comparisons without a consistent grouping of increases, decreases, and unchanged categories. “The same action happened” is also an imprecise link between the Spanish and French trends. Organising the comparisons more systematically and using clearer references to categories would make cohesion less mechanical and improve the flow between sentences.
Lexical Resource: Band 6.0
You use an adequate range of vocabulary for describing charts, including “percentage,” “proportion,” “declining,” and “increased.” These choices allow the reader to understand the main trends, and you attempt some variation rather than relying only on “went up” and “went down.” However, several expressions are awkward or imprecise, such as “the same action happened,” “got lower,” and “people who speak two other languages.” There are also spelling errors in “incresed,” and “can not” is conventionally written as “cannot.” Aim for more natural chart-reporting collocations and consistent category labels, such as “students who spoke two additional languages.” These refinements would make the vocabulary more precise and controlled.
Grammatical Range and Accuracy: Band 6.0
You use a mix of simple and more complex forms, including relative clauses (“who can not speak…”) and comparison structures (“declining from 20%…to 10%”). Most meanings remain clear, but some grammatical errors are noticeable. The opening should be “The pie charts illustrate,” because the plural subject requires a plural verb. In the overview, “the students…represents” has a subject–verb agreement problem, and “the lowest percentage accounted for the people” is an awkward construction. The final sentence also has faulty punctuation in “from 10% in 2000. to 15% in 2010.” Check agreement, sentence boundaries, and tense consistency when describing past data. More consistently accurate complex sentences would strengthen control.
See this exact question answered at other band scores. The same prompt compared across bands.
Browse more IELTS Writing model answers or get your own writing scored by the same AI examiner.