Band 5.0 IELTS Writing Task 1 Model Answer
Overall Band Score: 5.0 · Cambridge IELTS 11 · 2026-11-10
IELTS Writing Task 1 question
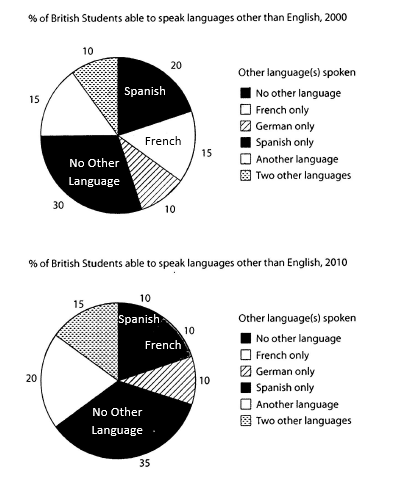
The charts below show the proportions of British students at one university in England who were able to speak other languages in addition to English, in 2000 and 2010
Summarise the information by selecting and reporting the main features, and make comparisons where relevant.
Student answer (Band 5.0)
The pie charts demonstrate the percenteges of british pupils who could speak other languages and english as well in one university, in 2000 and 2010.
Overall, the most of they were'nt able to talk with any languages which was the dominant part. On the other hand there were few students who spoke only german both of them in 2000 and 2010.
For those didn't speak anything else were the most with high percenteges which were almost the quarter in 2000, about the half in 2010. There were at least few pupils were able to speak german in 2000 and then the number increased in 2010, while some of them could manage two other ones with the same proportions in 2000/2010.
French and spanish were spoken by numerous of learners in 2000, however the supply decline in 2010. There was oher language which the most lf people were able to talk with in 2000, the amount raised in 2010 which was the most language students were able to it.
AI examiner evaluation
| Criterion | Band |
|---|---|
| Task Achievement / Task Response | 5.0 |
| Coherence and Cohesion | 5.5 |
| Lexical Resource | 5.0 |
| Grammatical Range and Accuracy | 5.0 |
| Overall | 5.0 |
Task Achievement / Task Response: Band 5.0
You identify the charts’ subject and make an attempt at an overview by noting that students with no other language were a large group and that German remained a smaller category. However, several key figures and trends are misreported: no other language rose from 30% to 35%, not from about a quarter to about half; German stayed at 10% in both years, rather than increasing; and two other languages rose from 10% to 15%, rather than remaining the same. You also say another language was the largest category in 2010, although no other language was largest. The response therefore covers some relevant features, but inaccuracies and unclear comparisons limit how fully it reports the main information. Prioritise an accurate overview and select a few correct comparisons.
Coherence and Cohesion: Band 5.5
The response has a basic paragraph structure: an introduction, an overview, and two paragraphs describing categories. This gives the reader some sense of how the information is organised. However, progression within the paragraphs is difficult to follow, and several comparisons are joined in ways that obscure their meaning. For example, “There were at least few pupils…” combines German and two-language figures without clearly separating the categories, while “There was oher language…” is hard to connect to the preceding discussion. Linking words such as “On the other hand” and “however” are attempted, but do not consistently clarify the relationships between points. Group the figures by clear trends and use direct references to each category and year.
Lexical Resource: Band 5.0
You use some task-related vocabulary, including “pie charts,” “proportions,” “dominant,” and “decline,” and you attempt to describe changes over time. However, the range is limited and several word choices or collocations make the report difficult to understand. Phrases such as “talk with any languages,” “the supply decline,” and “the most language students were able to it” are not natural ways to describe language categories in a chart. There are also spelling errors, including “percenteges” and “oher,” and “pupils” is less precise than “students” in this context. Build a small set of accurate chart-reporting expressions, such as “accounted for,” “remained unchanged,” and “increased from … to …,” and check spelling.
Grammatical Range and Accuracy: Band 5.0
You attempt both simple and more complex sentences, including clauses introduced by “which,” “while,” and “however.” However, errors are frequent, and some sentences are difficult to interpret. Examples include “the most of they were'nt able,” “For those didn't speak anything else were the most,” and “There was oher language which the most lf people were able to talk with.” These show problems with sentence construction, pronouns, verb forms, and clause structure. Agreement and tense are also inconsistent, as in “the amount raised” when describing a chart comparison. Aim first for clear, complete sentences with a subject and verb, then add subordinate clauses only when their relationship to the main idea is clear. Proofread punctuation and apostrophes as well.
See this exact question answered at other band scores. The same prompt compared across bands.
Browse more IELTS Writing model answers or get your own writing scored by the same AI examiner.