Band 5.5 IELTS Writing Task 1 Model Answer
Overall Band Score: 5.5 · Cambridge IELTS 11 · 2026-11-11
IELTS Writing Task 1 question
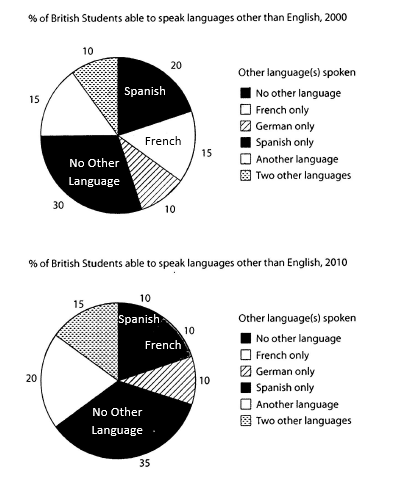
The charts below show the proportions of British students at one university in England who were able to speak other languages in addition to English, in 2000 and 2010
Summarise the information by selecting and reporting the main features, and make comparisons where relevant.
Student answer (Band 5.5)
The given pie charts demonstrate the proportion of multilingual british students 2000 and 2010.
Overall, a majority of British students didn't speak
any other language than english in 2000 and 2010.
To begin with, the greatest proportion of 30% of British peers didn't speak any foreign language in 2000. 20% of students spoke Spanish followed by 15% of French speakers and bilingual students.Moreover, 10% of students spoke German only and a similar percentage of students spoke 2 languages in addition to English.
On the other hand, 35% of students didn't speak any language except English while 20% spoke another language in 2010. In addition to this,15% spoke two other languages apart from English. Moroeover, 10% of the total were Spanish speakers and so were French speakers in 2010.
A glance at the pie charts indicates that
AI examiner evaluation
| Criterion | Band |
|---|---|
| Task Achievement / Task Response | 5.0 |
| Coherence and Cohesion | 5.0 |
| Lexical Resource | 5.5 |
| Grammatical Range and Accuracy | 5.5 |
| Overall | 5.5 |
Task Achievement / Task Response: Band 5.0
You identify the main categories and report several figures accurately, including the rise in students speaking no other language from 30% to 35%, and the 2010 figures for another language and two other languages. However, the response only partially summarises the charts: it does not clearly compare the two years or highlight the main shifts, such as Spanish falling from 20% to 10% and French from 15% to 10%, while German remained at 10%. The overview says a majority spoke no other language, but this is inaccurate because the figures are 30% and 35%, not a majority. The final sentence is unfinished, leaving the report incomplete. The response is also 14 words below the required minimum, which limits the detail provided.
Coherence and Cohesion: Band 5.0
The response has a basic structure, with an opening, an overview, and separate discussion of the two years. Phrases such as “To begin with” and “On the other hand” help signal movement between points. However, progression is limited: the 2000 and 2010 figures are mostly listed separately rather than organised around meaningful comparisons, and “On the other hand” does not express a clear contrast between the data. The final line, “A glance at the pie charts indicates that”, is incomplete and disrupts the ending. Some links are also awkwardly placed, so the reader has to infer how the figures relate. Grouping changes and unchanged categories together would create a clearer overall progression.
Lexical Resource: Band 5.5
You use enough topic vocabulary to communicate the basic information, including “proportion”, “spoke Spanish”, and “another language”. There is some variation in how you describe the categories, but several choices are imprecise or repetitive: “multilingual British students” does not accurately describe all chart categories, since some students spoke only English, and “bilingual students” is unclear in this context. “Foreign language” is understandable but less precise than the chart’s wording, while “peers” is not a natural choice for reporting these figures. Spelling and capitalisation also need attention, including “Moroeover” and lowercase “british” and “english”. More precise chart-reporting vocabulary would improve clarity and style.
Grammatical Range and Accuracy: Band 5.5
You produce several understandable simple sentences and attempt some more developed structures, such as “20% of students spoke Spanish followed by 15% of French speakers”. Most of the intended meaning can be followed, but control is uneven. The opening phrase “the proportion of multilingual British students 2000 and 2010” is missing a preposition, and “a majority … didn't speak” does not agree with the figures being described. The sentence beginning “Moreover, 10%...” joins two ideas without clear punctuation, while spacing after commas is inconsistent. The final sentence is unfinished, so it cannot function as a complete grammatical conclusion. Practise accurate comparison structures and check that every sentence has a complete clause and appropriate punctuation.
See this exact question answered at other band scores. The same prompt compared across bands.
Browse more IELTS Writing model answers or get your own writing scored by the same AI examiner.