Band 6.0 IELTS Writing Task 1 Model Answer
Overall Band Score: 6.0 · Cambridge IELTS 11 · 2026-11-12
IELTS Writing Task 1 question
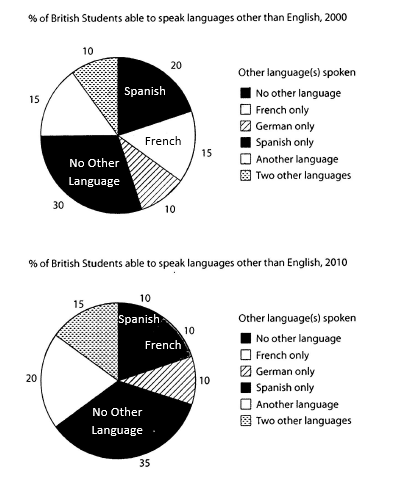
The charts below show the proportions of British students at one university in England who were able to speak other languages in addition to English, in 2000 and 2010
Summarise the information by selecting and reporting the main features, and make comparisons where relevant.
Student answer (Band 6.0)
The given two pie charts depicts the percentage of British students who are able to speak languages other than english from year 2000 to 2010.
Overall it is observed from all the perspectives that the student who speak no other languages are the highest and the students who speak German was the lowest among all the other langiages.
To commence with, the majority of student does not speak any other language other than english in the year 2000 which is 30%, however, it got increased to 35% in the year 2010. Moreover, the number of students who learned German remained constant over the decade. Furthermore, the students who learned Spanish and French got decreased to 10% each in the year 2010 from 20% and 15%. Whereas, there was a slight increase in the students who learned another language from 15% to 20% bt the end of 2010. Adding to that, students who learned two other languages was at 10 % in 2000 and later it went to 15% by the end of the decade.
AI examiner evaluation
| Criterion | Band |
|---|---|
| Task Achievement / Task Response | 7.0 |
| Coherence and Cohesion | 6.5 |
| Lexical Resource | 5.5 |
| Grammatical Range and Accuracy | 5.5 |
| Overall | 6.0 |
Task Achievement / Task Response: Band 7.0
The response selects the main comparisons and reports the figures accurately: no other language rises from 30% to 35%, German remains at 10%, Spanish and French fall to 10% each, and the other categories increase. The overview also identifies the largest group in both years. This gives a clear account of the key trends and addresses the task well. However, the claim that German speakers were “the lowest” is not accurate for 2000, when German and two other languages were tied at 10%; in 2010, German was tied with French and Spanish. The overview would be more precise if it noted these ties and the overall shift towards students speaking no additional language.
Coherence and Cohesion: Band 6.5
The response has a clear overall structure: an introduction, an overview, and a paragraph comparing the figures. Its sequence is generally logical, and linking expressions such as “Moreover,” “Furthermore,” and “Adding to that” help connect points. This meets the lower-band expectation of coherent organisation and shows some of the flexibility associated with stronger cohesion. However, several transitions are mechanical or do not express the relationship precisely. “Whereas” begins a fragment-like contrast, while “To commence with” and “Adding to that” are unnecessary for a straightforward data summary. Grouping the decreases together and the increases or unchanged figures together would make the progression more purposeful and reduce the list-like effect.
Lexical Resource: Band 5.5
The vocabulary is sufficient to communicate the main data, with relevant terms such as “percentage,” “remained constant,” “increased,” and “decreased.” However, the range is limited and some choices are imprecise or repetitive: “students who learned” is used for language ability, and “from all the perspectives” does not clearly describe the chart. There are also noticeable spelling and form errors, including “english,” “langiages,” and “bt,” which reduce accuracy. Aim for precise chart language and vary the way you describe proportions and changes. For example, use “could speak” rather than “learned” when reporting the categories, and refer to “the proportion” or “the share” to avoid repeating “the number of students.”
Grammatical Range and Accuracy: Band 5.5
The response attempts a range of sentence forms, including contrast and time comparisons, and the main message remains understandable. However, errors in agreement and sentence construction are frequent enough to limit control. For example, “The given two pie charts depicts” should use a plural verb, and “the majority of student does not speak” has problems with both number and agreement. The opening overview also shifts awkwardly between “student” and “students,” while “Whereas, there was a slight increase” is not well integrated with the preceding sentence. Work on subject–verb agreement, articles and plural forms, and make sure contrast clauses are attached to complete sentences. More accurate simple structures would improve clarity before adding complexity.
See this exact question answered at other band scores. The same prompt compared across bands.
Browse more IELTS Writing model answers or get your own writing scored by the same AI examiner.