Band 5.5 IELTS Writing Task 1 Model Answer
Overall Band Score: 5.5 · Cambridge IELTS 11 · 2026-11-12
IELTS Writing Task 1 question
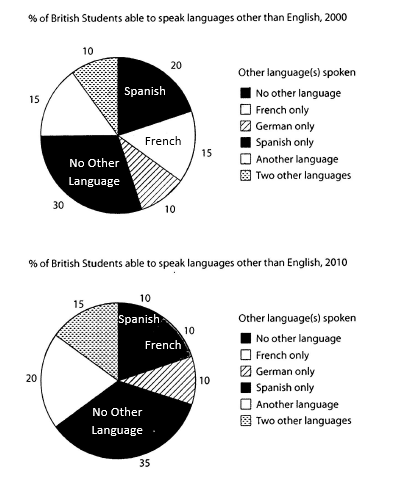
The charts below show the proportions of British students at one university in England who were able to speak other languages in addition to English, in 2000 and 2010
Summarise the information by selecting and reporting the main features, and make comparisons where relevant.
Student answer (Band 5.5)
The pie chart compares the ration of British students who knew how to speak different laguages excluding English of university in England in one decade.
Overall, it is evident that, over the period of time, proportions of student who spoke only english and another language had increased and ration of students declined who knew Spanish, French.
In 2001, the highest ration accounted by student who only spoke English which was 30%. There were equal proportions of students who were able to speal French and another language and which was 15 %. Similarly, there were 10% of studnets who knew German and Two other languages.
In 2010, 35% studenst were able to speak English language. On the contrast, only 10% were able to speak Spanish, French and German. The ration rose to 15 % who were abke to speak more than one language. On the other hand, a slight declined observed in stidnet who were able to speak another language rather than English was 20%.
AI examiner evaluation
| Criterion | Band |
|---|---|
| Task Achievement / Task Response | 5.5 |
| Coherence and Cohesion | 5.5 |
| Lexical Resource | 5.0 |
| Grammatical Range and Accuracy | 5.0 |
| Overall | 5.5 |
Task Achievement / Task Response: Band 5.5
You identify the broad shift towards more students speaking additional languages, and you include several relevant figures, such as 30% with no other language in 2000 and 35% in 2010. However, the overview is not fully accurate: the share speaking another language rose from 15% to 20%, while the proportion speaking two other languages rose from 10% to 15%; these are not simply students speaking “only English and another language.” The 2000 figures are also described as 2001, and the 2010 figure of 35% refers to students with no other language, not students able to speak English. Some categories are omitted or confused, so the main comparisons are only partly reported. State the years and category labels precisely, then summarise the largest changes in a clear overview.
Coherence and Cohesion: Band 5.5
The response has a recognisable structure: an introduction, an overview, and separate paragraphs for the two years. This gives the reader a basic route through the information. However, progression within paragraphs is uneven, and some links between ideas are confusing. For example, “On the contrast” introduces figures that are not actually contrasted, while “On the other hand” precedes a further category rather than a clear opposing point. The overview also combines categories in a way that makes the comparison difficult to follow. Group the figures by meaningful trends—for example, categories that increased, decreased, or stayed stable—and use linking phrases only when they express the relationship accurately. Clearer references to each category would also improve cohesion.
Lexical Resource: Band 5.0
You use some task-relevant vocabulary, including “proportions,” “accounted,” and “declined,” and the reader can generally recognise that the response describes chart data. However, the range and control are limited, with repeated use of “ration” and several inaccurate or misspelled forms, such as “speal,” “studnets,” and “abke.” Some expressions are also unnatural or imprecise: “ration of British students” and “35% students were able to speak English language” do not clearly describe the chart categories. Use standard data-reporting phrases such as “the proportion of students” and “accounted for,” and learn the exact category labels. Careful proofreading of spelling and collocations would make the comparisons easier to understand.
Grammatical Range and Accuracy: Band 5.0
The response attempts a few complex forms, including “who knew how to speak…” and “who were able to speak…,” but most sentences rely on basic patterns, and attempts at longer constructions are often faulty. For instance, “proportions of student who spoke… had increased and ration of students declined who knew Spanish, French” has problems with articles, agreement, and word order. In “There were equal proportions of students who were able to speal French and another language and which was 15%,” the clause structure is incomplete and difficult to follow. Tense and sentence construction also need more consistent control. Practise writing short, accurate comparisons first, then combine them using relative clauses or contrast structures, checking subject–verb agreement and articles.
See this exact question answered at other band scores. The same prompt compared across bands.
Browse more IELTS Writing model answers or get your own writing scored by the same AI examiner.