Band 5.5 IELTS Writing Task 1 Model Answer
Overall Band Score: 5.5 · Cambridge IELTS 11 · 2026-11-12
IELTS Writing Task 1 question
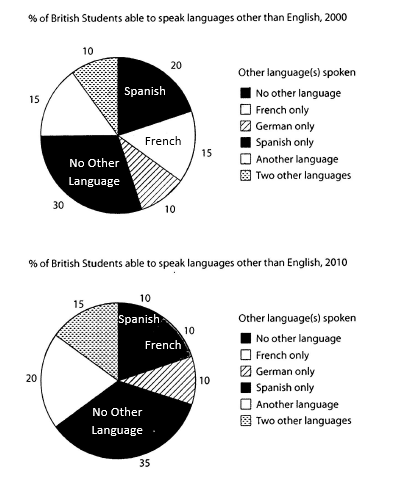
The charts below show the proportions of British students at one university in England who were able to speak other languages in addition to English, in 2000 and 2010
Summarise the information by selecting and reporting the main features, and make comparisons where relevant.
Student answer (Band 5.5)
The pie charts compares the proportion of British students who capable to speak foreign languages in 2000 and 2010. Overall, it is apparent that in both years there were higher proportion of British students not able to speak other language, while the students who speak german language and two other language speaker were lower. However, Spanish, French and German language speaker were lower in 2010.
As regard, the Brtish students who able no other language except English were accounted for 30% followed by spanish language speakers were 20%. In addition, the French and another language speaker were same proportion in 2000 at 15%. Whereas, the percentage of German and two other languages spoken by the students 10%.
In 2010, the percentage of United Kingdom residents who able to spoke French, Spanish and German were accounted for same proportion for 10%. While another language speakers were slightly higher than two other language speaker were 20% and 15% respectively. Furthermore, there was slight increase in British students who did not able to spoke other language at 35%.
AI examiner evaluation
| Criterion | Band |
|---|---|
| Task Achievement / Task Response | 6.0 |
| Coherence and Cohesion | 6.0 |
| Lexical Resource | 5.5 |
| Grammatical Range and Accuracy | 5.0 |
| Overall | 5.5 |
Task Achievement / Task Response: Band 6.0
You identify the two years and report several key proportions accurately, including the rise in students speaking no other language from 30% to 35%, and the changes in Spanish, French and other-language categories. The overview also recognises that Spanish, French and German shares were lower or unchanged by 2010. However, the opening overview is partly unclear: saying that students unable to speak another language were the larger group is not accurate, since this category was 30% and 35%, below the combined share of students speaking at least one other language in both years. The claim that German and two-language speakers were among the highest groups is also misleading; they were the smallest or joint-smallest categories. Make the overview more precise and distinguish individual categories from combined totals.
Coherence and Cohesion: Band 6.0
The response has a clear overall arrangement: an introduction and overview are followed by separate descriptions of 2000 and 2010. This makes the two charts easy to follow, and linking expressions such as “In addition,” “Whereas,” and “Furthermore” help signal relationships. However, some connections are mechanical or incomplete. For example, “Whereas, the percentage…” is not a complete contrast structure, and the opening overview combines several comparisons without a clear hierarchy. The repeated use of “In addition” and “Furthermore” also adds little to the progression. Group the main changes more deliberately—for example, first compare the largest category, then the language-specific categories—and use clear sentence links rather than relying mainly on transition words.
Lexical Resource: Band 5.5
You use relevant chart vocabulary, including “proportion,” “percentage,” “speakers,” and “slight increase,” so the main information is generally understandable. There is also some attempt to vary expressions for the categories. However, several word choices and collocations are inaccurate or awkward, such as “students who capable,” “students who able no other language,” and “two other language speaker.” “Residents” is also an imprecise substitute for the chart’s British students, while “foreign languages” is less exact than “other languages.” Spelling errors such as “Brtish” and inconsistent capitalization of “German” and “Spanish” reduce accuracy. Use the chart’s category labels consistently and choose natural phrases such as “students who spoke no other language” and “students speaking two other languages.”
Grammatical Range and Accuracy: Band 5.0
You attempt a mixture of simple statements and longer comparisons, and the reader can usually understand the intended figures. However, errors in sentence structure and verb forms occur across the response. Examples include “The pie charts compares,” “students who capable to speak,” and “who able to spoke”; these need subject–verb agreement and correctly formed clauses, such as “The pie charts compare” and “students who were able to speak.” There are also problems with articles and number agreement in “there were higher proportion” and “two other language speaker.” The sentence beginning “Whereas” is a fragment, and the final sentence has an awkward clause structure. Practise accurate basic patterns for describing percentages, then add complex comparisons while checking each clause for a subject and a correctly formed verb.
See this exact question answered at other band scores. The same prompt compared across bands.
Browse more IELTS Writing model answers or get your own writing scored by the same AI examiner.