Band 4.0 IELTS Writing Task 1 Model Answer
Overall Band Score: 4.0 · Cambridge IELTS 11 · 2026-11-12
IELTS Writing Task 1 question
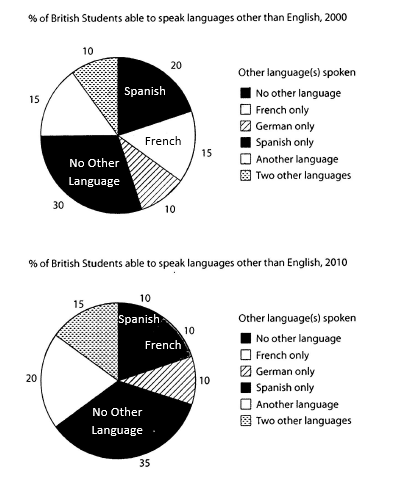
The charts below show the proportions of British students at one university in England who were able to speak other languages in addition to English, in 2000 and 2010
Summarise the information by selecting and reporting the main features, and make comparisons where relevant.
Student answer (Band 4.0)
The pie chart illustrates the percentage of British students able to speak languages other than British in one university in England from 2000 to 2010. The units are measured in percent.
Overall, a plethora of students who doesn't speak other languages they have a higher percentage comparing with the other languages
AI examiner evaluation
| Criterion | Band |
|---|---|
| Task Achievement / Task Response | 3.0 |
| Coherence and Cohesion | 4.5 |
| Lexical Resource | 4.5 |
| Grammatical Range and Accuracy | 4.5 |
| Overall | 4.0 |
Task Achievement / Task Response: Band 3.0
The response identifies the chart topic and attempts an overall comparison, noting that students who speak no other language form a larger group than those in the other categories. However, it does not report any figures or describe how the proportions changed between 2000 and 2010, so the main features of the charts are largely missing. The overview is also incomplete: the no-other-language group rose from 30% to 35%, while Spanish fell from 20% to 10%; these are important contrasts that could have been selected. The response is only 51 words, below the required 150, which leaves the task minimally addressed. To improve, include a clear overview and compare several key categories using accurate data.
Coherence and Cohesion: Band 4.5
There is a basic attempt to organise the response: an introductory sentence is followed by a separate paragraph beginning “Overall,” which signals an overview. This gives the reader a simple starting structure. However, the response ends before developing the comparison, so there is no logical progression through the chart information and no supporting details. The sentence in the overview is difficult to follow because “who doesn't speak other languages they have” combines two structures without a clear connection. Build a short sequence of paragraphs: introduce the charts, summarise the main trends, then compare the most relevant categories. Use clear links such as “whereas” or “by contrast” to connect comparisons.
Lexical Resource: Band 4.5
The response uses some relevant chart vocabulary, including “percentage,” “pie chart,” and “languages,” and the topic is generally recognisable. However, the range is very limited because the response contains little description of data or change. Some choices are inaccurate or unnatural: “languages other than British” should refer to languages other than English, and “a plethora of students” is an unsuitable, overly elaborate phrase for a proportion. “Higher percentage comparing with” is also an awkward collocation. Use precise terms such as “proportion,” “accounted for,” “increased,” and “declined,” and name the categories consistently. This would make the description more concise and appropriate to an academic chart summary.
Grammatical Range and Accuracy: Band 4.5
The response shows a small amount of sentence variety, with a present-tense introduction and an attempted overview, and the opening sentence is mostly understandable. However, grammatical control is uneven. In “students who doesn't speak,” the verb does not agree with the plural noun; “who do not speak” is needed. The overview also contains a faulty construction: “they have a higher percentage comparing with” lacks a clear grammatical relationship and uses an incorrect comparison pattern. The phrase “from 2000 to 2010” is understandable, though the charts show two separate years. Practise accurate comparative sentences, for example, “The proportion with no other language was higher than the other categories in both years.”
See this exact question answered at other band scores. The same prompt compared across bands.
Browse more IELTS Writing model answers or get your own writing scored by the same AI examiner.