Band 5.5 IELTS Writing Task 1 Model Answer
Overall Band Score: 5.5 · Cambridge IELTS 11 · 2026-11-14
IELTS Writing Task 1 question
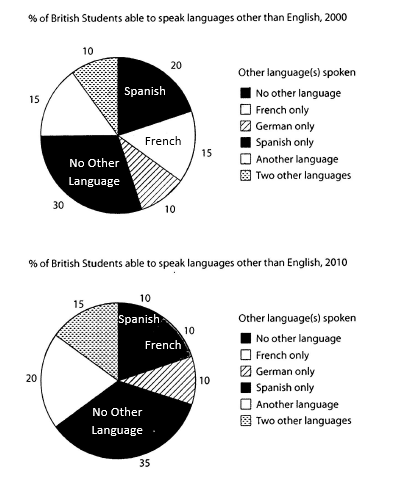
The charts below show the proportions of British students at one university in England who were able to speak other languages in addition to English, in 2000 and 2010
Summarise the information by selecting and reporting the main features, and make comparisons where relevant.
Student answer (Band 5.5)
The two pie charts gives percentages of Britich students who can speak other language in addition to English at the same university , in the period 2000 and 2010.
Overall, it is clear that no other language accounted for the largest proportion in both years . whereas the too smalles parts in 2000 were for Germany and two other lanuage while after 10 years Freansh and Spanish recorded dramtically decrease in percentage respectively by 5% and 10% .However , Germany language remained stable and constant during the period.
In 2000, no other language witnessed a significant large part at 30% , followed by 20% for Spanish language and another langugaes just for 15% . In contrast , Germany and two other languages are similar in same percetage at 10%.
In 2010, Germany language remaind stable and unchanged at the same the point 10% . In the other hand , No other language still achieved the highest shape from the total at 35% .In addition , Freansh and Spanish language recorded steadily fall in percentage respectively by 5% and 10%.
AI examiner evaluation
| Criterion | Band |
|---|---|
| Task Achievement / Task Response | 5.5 |
| Coherence and Cohesion | 5.5 |
| Lexical Resource | 5.0 |
| Grammatical Range and Accuracy | 5.0 |
| Overall | 5.5 |
Task Achievement / Task Response: Band 5.5
You identify the main overall pattern: “No other language” is the largest category in both years, and German remains at 10%. You also report the falls in Spanish and French and the rise in “No other language” accurately. However, the account is only partial because several important changes are omitted: “another language” rises from 15% to 20%, and “two other languages” increases from 10% to 15%. The overview also calls German and two other languages the smallest categories in 2000, although French is also tied at 15% with another language, and the 2010 smallest categories are not clearly identified. Include the full set of notable shifts and make comparisons across both charts more consistently.
Coherence and Cohesion: Band 5.5
The response has a recognisable structure, with an introduction, an overview and separate paragraphs for 2000 and 2010. This helps the reader follow the basic comparison. However, progression is uneven: the overview repeats details that are then revisited, while the final paragraph gives little information beyond the stable German figure and the declines in French and Spanish. Linking is sometimes mechanical or unclear, as in “In contrast” and “In the other hand,” and punctuation around connectors is inconsistent. Organise the body around the main comparisons—categories that rose, fell or stayed unchanged—rather than repeating year-by-year points, and use linking phrases accurately to make relationships between figures clearer.
Lexical Resource: Band 5.0
You use some relevant chart vocabulary, including “percentages,” “accounted for,” “followed by” and “remained stable,” so the topic is generally understandable. However, the range is limited and several inaccurate or misspelled expressions make the report less clear, such as “the highest shape,” “significant large part,” “Germany language” and “recorded steadily fall.” Repeated use of “language” also makes the description sound awkward. Choose precise terms for chart categories and movements, such as “proportion,” “category,” “rose” and “declined,” and check spelling carefully; errors such as “Britich,” “Freansh” and “lanuage” are noticeable. More accurate collocations would make the comparisons easier to interpret.
Grammatical Range and Accuracy: Band 5.0
You attempt both simple and more complex sentences, including a contrast with “whereas” and a sentence describing changes over time. However, grammatical control is inconsistent, and errors sometimes make relationships difficult to follow. For example, “The two pie charts gives” has subject–verb disagreement, while “the same the point 10%” contains an incorrect construction. The sentence beginning “Overall” also joins contrasting ideas awkwardly, and punctuation around full stops and commas is often misplaced. Practise accurate agreement and sentence boundaries, and build comparisons with clear patterns such as “Spanish fell from 20% to 10%, whereas German remained at 10%.”
See this exact question answered at other band scores. The same prompt compared across bands.
Browse more IELTS Writing model answers or get your own writing scored by the same AI examiner.