Band 5.5 IELTS Writing Task 1 Model Answer
Overall Band Score: 5.5 · Cambridge IELTS 11 · 2026-11-14
IELTS Writing Task 1 question
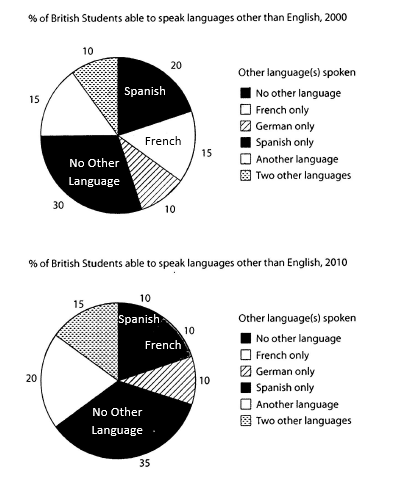
The charts below show the proportions of British students at one university in England who were able to speak other languages in addition to English, in 2000 and 2010
Summarise the information by selecting and reporting the main features, and make comparisons where relevant.
Student answer (Band 5.5)
The pie charts show the proportions of British students at one of the university of England who can also speak other languages in addition to english, in 2000 and 2010.
In 2000, The largest group of students are not able to speak other language, make-up 35%. While students who can speak Spanish accountable for 20%. On other hand students who can speak french and another languages was accounted of 15% each. Futhermore, Garman and other two languages was making-up 10% each.
However, In 2010 students who can not speak another language still made largest proportion 35%. While languages like Spanish, franch and german were popular in students made-up 10% individual. Other two languages, were spoken by 15% of students. However, student who can able to speak another language also increase and made-up 20% of students.
Overall, The proportion the students who can not speak another language remain popular all over the years, and languages such as spanish, french and garman was comman languages while other languages were included in proportion of another langages.
AI examiner evaluation
| Criterion | Band |
|---|---|
| Task Achievement / Task Response | 5.5 |
| Coherence and Cohesion | 5.5 |
| Lexical Resource | 5.0 |
| Grammatical Range and Accuracy | 5.0 |
| Overall | 5.5 |
Task Achievement / Task Response: Band 5.5
You identify the main categories and make relevant comparisons between the two years, including the decline in Spanish and the rise in “another language” and “two other languages.” However, several figures are inaccurate: in 2000, “No Other Language” was 30%, not 35%, and in 2010 it was 35%, not simply a continuing 35%. The overview also says that Spanish, French and German were common, but does not clearly summarise the key changes across the charts. Some descriptions are unclear, such as “languages like Spanish, franch and german were popular in students.” To improve, check each figure against the chart and give a concise overview of the largest category and the main shifts.
Coherence and Cohesion: Band 5.5
The response has a recognisable structure: an introduction, a paragraph for each year, and a concluding overview. This helps the reader follow the broad comparison. However, progression is weakened by repeated and sometimes confusing linking words, particularly “While” and “However”; the latter introduces the 2010 paragraph even though it does not express a clear contrast with the previous point. The final overview repeats the idea that students without another language were the largest group rather than drawing together the main changes. Some sentences also combine figures in a way that makes relationships unclear. Organise the body around comparable categories or clear year-by-year reporting, and use linking expressions only when their logical relationship is accurate.
Lexical Resource: Band 5.0
You use some relevant chart vocabulary, including “proportions,” “largest group,” and “made-up,” and the reader can generally identify the categories being discussed. However, the range is limited and several word choices or collocations are inaccurate, such as “accountable for 20%,” “popular in students,” and “remain popular.” Spelling errors—including “Futhermore,” “Garman,” “franch,” and “comman”—also reduce precision, while repeated use of “speak” and “made-up” makes the report less flexible. Aim for accurate, conventional language for describing data, such as “accounted for,” “represented,” “rose,” and “fell,” and check the spelling of category names before submitting.
Grammatical Range and Accuracy: Band 5.0
You attempt to connect ideas using subordinate clauses and contrast markers, but sentence structures are often faulty, and errors sometimes make the intended relationships difficult to follow. For example, “The largest group of students are not able to speak other language, make-up 35%” has problems with agreement, article use, and sentence construction. “students who can speak french and another languages was accounted of 15% each” also contains errors in agreement and clause structure. Capitalisation is inconsistent, as in “In 2000, The largest group,” and several sentences begin with “While” without a complete main clause. Practise building accurate comparison sentences with a clear subject and verb, and check agreement, articles, plurals, and punctuation.
See this exact question answered at other band scores. The same prompt compared across bands.
Browse more IELTS Writing model answers or get your own writing scored by the same AI examiner.