Band 5.0 IELTS Writing Task 1 Model Answer
Overall Band Score: 5.0 · Cambridge IELTS 11 · 2026-11-15
IELTS Writing Task 1 question
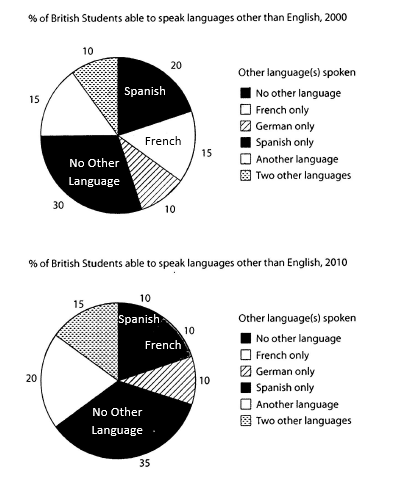
The charts below show the proportions of British students at one university in England who were able to speak other languages in addition to English, in 2000 and 2010
Summarise the information by selecting and reporting the main features, and make comparisons where relevant.
Student answer (Band 5.0)
The circle graph illustrates the proportion of British students at one England university, the students who were know to speak other languages in addition to English ,in 2000 and in 2010.
Overall, the cicrle graph illustrates a common change in both diagram of 2000 and 2010. The British students who can speak Spanish was show 10 percent difference in both diagram of 2000 and 2010. The students who do not know other language show only 5 percent difference in both diagram of 2000 and 2010. But German language remains same in both diagram of 2000 and 2010.
In 2000, circle graph illustrates 30 percent No other language, Thus Spanish show 20 percent. The French language and Another language both illustrates 15 percent . But German language and two other languages both are illustrates 10 percent only.
In 2010, circle graph illustrates Spanish, French, German languages all are illustrates only 10 percent. Otherwise, Two other languages illustrates 15 percent. And Another languages illustrates 20 percent. But No other language illustrates 35 percent in circle graph of 2010.
My opinion is that the cicrle graph of 2000 and the cicrle graph of 2010 both are illustrates a common change in the all languages.
AI examiner evaluation
| Criterion | Band |
|---|---|
| Task Achievement / Task Response | 5.5 |
| Coherence and Cohesion | 5.5 |
| Lexical Resource | 5.0 |
| Grammatical Range and Accuracy | 4.5 |
| Overall | 5.0 |
Task Achievement / Task Response: Band 5.5
You report most of the chart figures accurately, including the 2000 shares for no other language (30%), Spanish (20%), and French and another language (15% each), as well as the 2010 figures. You also identify relevant changes: the share with no other language rises by five percentage points, while German remains unchanged. However, the overview is unclear and partly inaccurate: saying Spanish shows a “10 percent difference” does not explain that its share falls from 20% to 10%, and the claim that students who “do not know other language” show a difference is imprecise. The final personal opinion is not appropriate for a chart summary and repeats the vague idea of a “common change.” State the main increases and decreases directly and objectively.
Coherence and Cohesion: Band 5.5
The response has a recognisable structure: an introduction, an overview, and separate paragraphs for 2000 and 2010. This helps the reader locate the figures, and the year-by-year grouping is a sensible way to organise the information. However, progression is weakened by repetition: “circle graph illustrates” appears repeatedly, and the overview and final paragraph do not add a clear synthesis. Connect the years through direct comparisons rather than listing each chart in isolation. Some linking words, such as “But” and “Otherwise,” do not clearly express the relationship between the information that follows. A concise overview followed by grouped comparisons would make the organisation more coherent and the connections less mechanical.
Lexical Resource: Band 5.0
You use relevant chart vocabulary, including “proportion,” “percent,” and language labels, so the topic is generally understandable. However, the range is limited and several phrases are repeated, especially “circle graph illustrates.” Some word choices and collocations are inaccurate or awkward, such as “common change,” “10 percent difference,” and “students who do not know other language.” Spelling errors such as “cicrle” also reduce accuracy. Use precise reporting language to describe movement and comparison, and vary the verbs used to introduce data. For example, say that a proportion “rose,” “fell,” or “remained unchanged,” rather than describing a vague “difference.”
Grammatical Range and Accuracy: Band 4.5
The response mainly uses simple sentence patterns, with limited control of more varied structures. Errors in verb forms and agreement occur throughout, as in “students who were know to speak,” “Spanish was show,” and “German language remains same.” Articles and sentence construction are also problematic in phrases such as “at one England university” and “both are illustrates.” These errors sometimes make the intended relationship between figures less clear, although the reader can usually identify the data being reported. Practise forming accurate comparison sentences with a clear subject and verb—for example, “The proportion speaking Spanish fell from 20% to 10%”—and check agreement, tense, and articles in each sentence.
See this exact question answered at other band scores. The same prompt compared across bands.
Browse more IELTS Writing model answers or get your own writing scored by the same AI examiner.