Band 5.5 IELTS Writing Task 1 Model Answer
Overall Band Score: 5.5 · Cambridge IELTS 11 · 2026-11-16
IELTS Writing Task 1 question
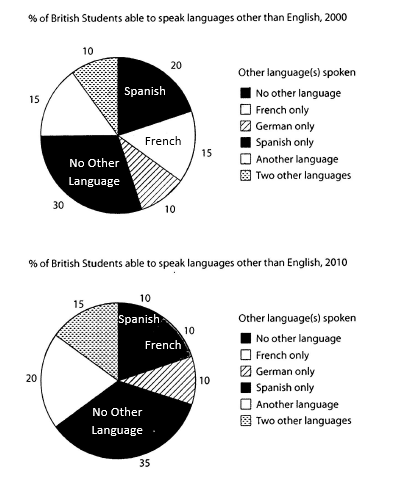
The charts below show the proportions of British students at one university in England who were able to speak other languages in addition to English, in 2000 and 2010
Summarise the information by selecting and reporting the main features, and make comparisons where relevant.
Student answer (Band 5.5)
The diagram show the percentages of British students at a Universuty in England who were able to speak different languages in addittion to English, in 2000 and 2010.
In 2000 and 2010 there were no much differences on the people who were able to speak different languages and the people who weren't able to speak apart from the English Language. However, in 2010, there was a little increase of the students who couldn't speak other languages as well as a decrease in the number students speaking Spanish and French only.
In 2000, the percentage of British students able to speak some languages other than English was quite low. 30 percent of the students weren't able to speak any other language apart from English. The French and a different language had the same amount of students by 15 percent, as well as the students who could also speak two other languages and German only having the same percentage of students. While, the spanish language had 20 percent of the students.
In 2010, there were some changes as the least number of students in 2 different languages had reduced as it was higher in 2000. The German language remained the same having 10 percent of students, also sharing the same percentage in Spanish and French. While, the students who could speak two different languages were having 15 perecent, the students who couldn't speak any apart from English was 35 percent, quite an increase of 5 percent from 2000. On the other hand, students who could speak another language was 20 percent which is also an increase from 2000
AI examiner evaluation
| Criterion | Band |
|---|---|
| Task Achievement / Task Response | 5.5 |
| Coherence and Cohesion | 6.0 |
| Lexical Resource | 5.0 |
| Grammatical Range and Accuracy | 5.5 |
| Overall | 5.5 |
Task Achievement / Task Response: Band 5.5
You report several key figures accurately, including the rise in students speaking no other language from 30% to 35%, the fall in Spanish from 20% to 10%, and the unchanged 10% for German. You also identify the increases for another language and two other languages. However, the overview is unclear: saying there were “no much differences” does not capture the main shift that the share speaking no other language increased while the combined share speaking other languages declined. Some descriptions are also imprecise, such as “the least number of students in 2 different languages had reduced,” which appears to confuse the two-other-languages category. A clearer overview and more precise comparisons would make the main features easier to understand.
Coherence and Cohesion: Band 6.0
The response has a recognisable structure: an introduction, a general comparison, and separate paragraphs for 2000 and 2010. This gives the reader a workable route through the information. However, progression within paragraphs is sometimes uneven, and several points are repeated, particularly the figures for students speaking no other language. Linking words such as “However,” “While,” and “On the other hand” are used, but some do not clearly express the relationship between the figures that follow. For example, “While” introduces a standalone statement about Spanish. Grouping the categories that rose, fell, or stayed unchanged, and using clearer references to each category, would improve the flow.
Lexical Resource: Band 5.0
You use relevant chart vocabulary, including “percentage,” “increase,” “decrease,” and “remained the same,” so the reader can generally follow your comparisons. However, the range is limited and some expressions are awkward or imprecise, such as “the same amount of students,” “the least number of students in 2 different languages,” and “speak apart from the English Language.” There are also noticeable spelling errors, including “Universuty,” “addittion,” “spanish,” and “perecent.” These reduce the accuracy and polish of the report. Use standard chart collocations and consistent category labels, such as “the proportion of students” and “those speaking two other languages,” and check spelling before submitting.
Grammatical Range and Accuracy: Band 5.5
You attempt both simple and more complex sentences, including comparisons joined with “as well as” and “while.” The main information is usually understandable, but some grammatical errors recur. For example, “The diagram show” has subject–verb disagreement, and “there were no much differences” uses an incorrect quantifier and noun form. In “the number students speaking Spanish,” a word is missing, while “the students who could speak two different languages were having 15 percent” uses an unsuitable verb construction. Sentence boundaries and punctuation also need attention, especially where clauses are joined with “While.” Aim for accurate basic sentence patterns first, then use complex comparisons with carefully controlled clauses.
See this exact question answered at other band scores. The same prompt compared across bands.
Browse more IELTS Writing model answers or get your own writing scored by the same AI examiner.