Band 6.5 IELTS Writing Task 1 Model Answer
Overall Band Score: 6.5 · Cambridge IELTS 11 · 2026-11-16
IELTS Writing Task 1 question
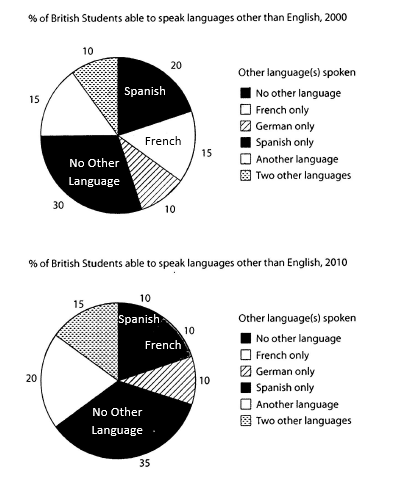
The charts below show the proportions of British students at one university in England who were able to speak other languages in addition to English, in 2000 and 2010
Summarise the information by selecting and reporting the main features, and make comparisons where relevant.
Student answer (Band 6.5)
The pie charts below illustrates percentage of British students from a particular university who were able to converse in other languages in addition to English, in the years 2000 and 2010.
Overall, it is observed that individuals who didn't speak any other languages accounted for one third or more, in both the years. Students who didn't speak any other language apart from English ,dominated in both the years. Spanish was the most spoken foreign language in 2000 while students conversed in another language ,the most in 2010
In 2000, Almost a third of students didn't speak any language apart from English(30%). Spanish was the most spoken foreign language, accounting for 20% speakers. This was followed by people who spoke French and others who spoke a different language , with both of them equally represented at 15%.Furthermore, there were similar proportions of people who only spoke German and those who spoke two other languages, making up 10% of the figures.
In 2010, there was a slight increase in people who spoke English as their only language, accounting for 35%.There was a decline in students who spoke Spanish and French, with both of them equally represented at 10%.There was a substantial increase in people who spoke another language, making up 20% of the figures.In addition, there was a rise in people who conversed in two other languages, making up 15% of the figures. Figures for people who spoke German remained unchanged at 10%.
AI examiner evaluation
| Criterion | Band |
|---|---|
| Task Achievement / Task Response | 7.0 |
| Coherence and Cohesion | 7.0 |
| Lexical Resource | 6.0 |
| Grammatical Range and Accuracy | 6.0 |
| Overall | 6.5 |
Task Achievement / Task Response: Band 7.0
The response selects the main features and reports the figures accurately: no other language rises from 30% to 35%, Spanish falls from 20% to 10%, and German remains at 10%. The overview also identifies the largest category in each year, although “students conversed in another language, the most in 2010” would be clearer as a comparison of the largest non-English-language category; the 35% with no other language is still the largest overall group. The account covers all six categories and makes relevant comparisons, including the equal 10% figures for Spanish and French in 2010. To strengthen the overview further, distinguish more explicitly between the overall largest group and the most common additional language, and avoid broad phrasing such as “one third or more” when the exact contrast is useful.
Coherence and Cohesion: Band 7.0
The response has a clear four-part structure: an introduction, an overview, and separate paragraphs for 2000 and 2010. This gives the reader a logical route through the information, and sequencing phrases such as “This was followed by” and “In addition” help connect details. Comparisons are generally grouped by year, so the account is easy to follow. Some linking is slightly repetitive or mechanical, particularly the repeated “In 2010” and “There was” constructions. Punctuation spacing also disrupts the flow in places, as in “15%.Furthermore” and “35%.There.” Use a wider range of concise comparison links and check spacing after full stops to make the progression smoother and less formulaic.
Lexical Resource: Band 6.0
The vocabulary is adequate for describing the chart, and the response uses relevant terms such as “accounting for,” “equally represented,” “substantial increase,” and “remained unchanged.” These choices communicate the main trends clearly. However, some wording is imprecise or repetitive: “people who spoke another language” could be confused with the chart’s specific “another language” category, while “conversed in” is repeated and sounds less natural for reporting language ability. “Figures” is also used broadly for percentages and groups. Aim for more precise category labels and natural collocations, such as “students speaking one additional language” and “the proportion of students.” This would add flexibility and precision while retaining the clear, task-appropriate vocabulary already present.
Grammatical Range and Accuracy: Band 6.0
The response uses a mix of simple and more complex forms, including the relative clause “who were able to converse” and the comparison structure “with both of them equally represented at 15%.” Most sentences communicate the intended information, but some grammatical and punctuation slips remain. The opening says “The pie charts … illustrates,” where the plural subject requires “illustrate.” In “accounted for one third or more, in both the years,” the comma is unnecessary, and spaces before commas appear in “English ,dominated” and “language ,the most.” Several sentences also run directly into the next after a full stop, such as “35%.There.” Review subject–verb agreement, sentence boundaries, and punctuation spacing. More consistently accurate control of these forms would improve the overall grammatical quality.
See this exact question answered at other band scores. The same prompt compared across bands.
Browse more IELTS Writing model answers or get your own writing scored by the same AI examiner.