Band 6.0 IELTS Writing Task 1 Model Answer
Overall Band Score: 6.0 · Cambridge IELTS 11 · 2026-11-16
IELTS Writing Task 1 question
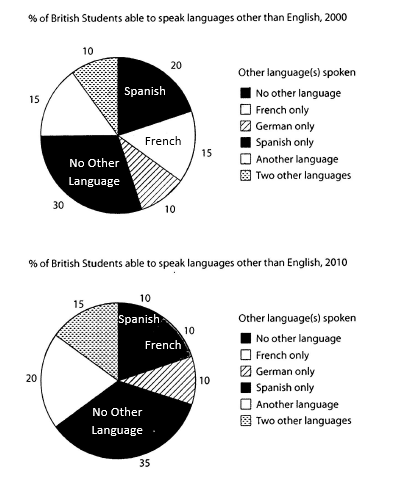
The charts below show the proportions of British students at one university in England who were able to speak other languages in addition to English, in 2000 and 2010
Summarise the information by selecting and reporting the main features, and make comparisons where relevant.
Student answer (Band 6.0)
There are two pi charts available that compares the British university students in 2000 and 2010 that were able to speak langyages other than English.
If we examine both the charts data carefully, we came accross that about 30% British students in a university didn't know any language other than English and the proportion rises in 2010by 5%. In 2000, about 20 percent students in the university spoke Spanish and about 15% of them were capable to speak French well.
Surprisingly, both the proportion of students who spoke Spanish and French declines significantly by ten and five percent respectively. The proportion of students who spoke German remained consistent in 2000 and 2010. However, the ratio of those students who were capable to speak two languages other than English elevates by five percent in 2010 as compared in 2000.
Moreover, there were some students who also spoke only one language other than English and the ratio also increases by 5% in 2010.
AI examiner evaluation
| Criterion | Band |
|---|---|
| Task Achievement / Task Response | 6.0 |
| Coherence and Cohesion | 6.0 |
| Lexical Resource | 5.5 |
| Grammatical Range and Accuracy | 5.5 |
| Overall | 6.0 |
Task Achievement / Task Response: Band 6.0
You identify several important comparisons accurately: the share speaking no other language rises from 30% to 35%, Spanish falls from 20% to 10%, French falls from 15% to 10%, and German remains at 10%. You also report the five-point increases for two other languages and another language. However, there is no clear opening overview that summarises the main pattern across both charts. The statement that students “spoke only one language other than English” is also unclear: the chart category is “another language,” and its share rises from 15% to 20%. Clarify this category and give a concise overview, such as the increase in students reporting no other language alongside the growth in the two “other language” categories.
Coherence and Cohesion: Band 6.0
The response has a generally understandable sequence: it introduces the charts, reports the no-language and language-specific figures, then describes further changes. Paragraphing also separates the discussion into manageable sections. However, the progression is not fully controlled because there is no distinct overview before the detailed comparisons, which makes the main message less prominent. Some linking is mechanical, particularly the repeated use of “Moreover” and “However,” and “Surprisingly” does not establish a clear logical relationship. The reference to “the ratio” is also vague, as readers must infer which category is meant. Organise the report into an introduction, a brief overview, and grouped details, using precise category names and links that show contrast or similarity.
Lexical Resource: Band 5.5
You use a reasonable range of task-related vocabulary, including “proportion,” “declines,” “remained consistent,” and “as compared.” These choices help communicate the main changes, and the meaning is generally recoverable. However, several spelling and word-choice problems reduce precision: “pi charts” and “langyages” are misspelled, while “came across” is not a natural way to introduce chart findings. Phrases such as “capable to speak” and “the ratio … elevates” are also awkward collocations. Use standard chart language consistently, such as “pie charts,” “the proportion increased,” and “students who could speak.” Naming the categories directly will also avoid vague wording such as “some students.”
Grammatical Range and Accuracy: Band 5.5
You attempt both simple and more complex sentence forms, including a conditional-style opening (“If we examine…”) and contrastive clauses beginning with “However.” Most of the intended comparisons remain understandable. Some grammatical errors nevertheless affect accuracy: “two pi charts … compares” has a subject–verb agreement problem, and “30% British students” needs an article or possessive construction. The phrase “rises in 2010by 5%” has faulty spacing and an unclear time expression, while “as compared in 2000” uses an incorrect preposition. There are also inconsistent tense choices, such as “we came across” when describing what the charts show. Practise accurate agreement, articles, prepositions, and consistent present-tense reporting.
See this exact question answered at other band scores. The same prompt compared across bands.
Browse more IELTS Writing model answers or get your own writing scored by the same AI examiner.