Band 5.0 IELTS Writing Task 1 Model Answer
Overall Band Score: 5.0 · Cambridge IELTS 11 · 2026-11-17
IELTS Writing Task 1 question
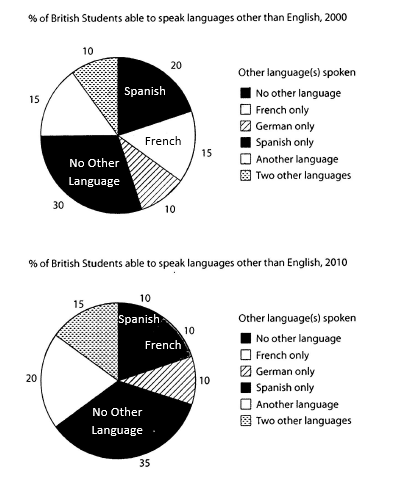
The charts below show the proportions of British students at one university in England who were able to speak other languages in addition to English, in 2000 and 2010
Summarise the information by selecting and reporting the main features, and make comparisons where relevant.
Student answer (Band 5.0)
The pie chart describes not only the ratio of British students at one university in England but also who are capable to speak other tougues in contrast to English in between two years 2000 to 2010.
Overall, comparing two pie charts the percentage of no other lunguage rose as campared to other dialects. In, 2000s Spanish is mostly preferable as well as in 2010 french only recommended .
On the one hand, in 2000s the british students percentages varies as no other speech ratio 30%. futhermore, French way of speaking correlation same 15% . Similarly , two other lunguages and German only remained same 10% estimated . However, Spanish tounge more spoke after there mother tounge 20% .
On the other hand , in 2010 the british students allow to spoke other dialects also differnt . As , no other languages percentage 35%which was high in contrast to 2000 . Afterwards, most valued french only quite 20% . Nevertheless, two other languages ratio 15% . Similarly, Spanish , French , and German ratio remained same 10% only .
So , camapring both years the british students prefarable to spoke there own mother dialects more in contrast to other tounges afterwords spanish likely spoke .
AI examiner evaluation
| Criterion | Band |
|---|---|
| Task Achievement / Task Response | 5.5 |
| Coherence and Cohesion | 5.5 |
| Lexical Resource | 4.5 |
| Grammatical Range and Accuracy | 5.0 |
| Overall | 5.0 |
Task Achievement / Task Response: Band 5.5
You identify the two years and report several relevant figures, including the rise in students with no other language (30% to 35%) and the unchanged 10% for German. However, some key comparisons are inaccurate: French was 15% in 2000 and 10% in 2010, not “20%” in 2010, and Spanish fell from 20% to 10%, rather than being the most spoken language in both years. The overview also says French was preferred in 2010, which is not supported by the chart; “another language” was 20%, the largest category among those speaking another language. The response therefore covers the task only partially, with some relevant data but an unclear or inaccurate account of the main features. Focus on the largest categories and describe changes precisely.
Coherence and Cohesion: Band 5.5
The response has a basic overall structure: an introduction, an overview, and separate paragraphs for 2000 and 2010. This gives the reader some sense of how the information is organised. However, progression within paragraphs is often difficult to follow, and the final paragraph repeats broad claims rather than drawing together accurate comparisons. Linking phrases such as “On the one hand,” “However,” and “Nevertheless” are used, but sometimes do not show a clear contrast between the figures that follow. Punctuation and spacing also interrupt the flow. Group the data by meaningful trends—for example, categories that rose, fell, or stayed unchanged—and use simpler, more precise links so the comparisons are easier to track.
Lexical Resource: Band 4.5
You attempt a range of vocabulary related to the topic, including “percentage,” “ratio,” “preferable,” and “remained same.” However, word choice and collocation are frequently inaccurate or repetitive, which sometimes makes the meaning difficult to understand. For example, “other dialects,” “other speech,” and “mother dialects” are unsuitable for describing languages, while “French only recommended” does not express the chart information clearly. There are also many spelling errors, including “tounges,” “lunguage,” and “camapring.” Use the chart’s own terms—such as “students speaking another language” and “French only”—and practise accurate forms of common reporting verbs like “rose,” “fell,” and “accounted for.”
Grammatical Range and Accuracy: Band 5.0
You make some attempts to combine ideas and compare years, but the range of sentence structures is limited, and errors occur frequently. For example, “the British students allow to spoke” has an incorrect verb construction, while “the British students percentages varies” has problems with agreement and sentence formation. Articles and prepositions are also often missing or misplaced, as in “in between two years 2000 to 2010.” Several sentences are fragments or awkwardly joined, such as “As, no other languages percentage 35%which was high in contrast to 2000.” These errors can make relationships between figures unclear. Build accurate simple sentences first, then practise controlled comparisons using patterns such as “The proportion rose from 30% to 35%” and “Spanish fell by 10 percentage points.”
See this exact question answered at other band scores. The same prompt compared across bands.
Browse more IELTS Writing model answers or get your own writing scored by the same AI examiner.