Band 4.5 IELTS Writing Task 1 Model Answer
Overall Band Score: 4.5 · Cambridge IELTS 11 · 2026-11-17
IELTS Writing Task 1 question
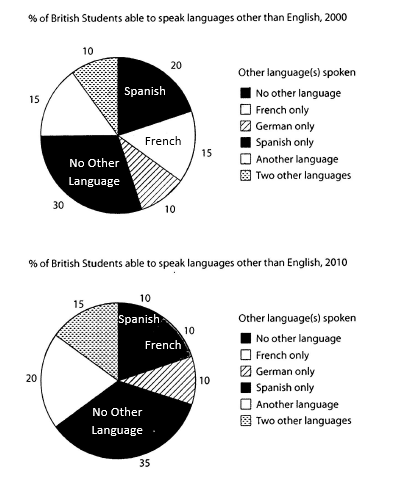
The charts below show the proportions of British students at one university in England who were able to speak other languages in addition to English, in 2000 and 2010
Summarise the information by selecting and reporting the main features, and make comparisons where relevant.
Student answer (Band 4.5)
The pie chart illustrates the percantage of British students at one university in England those who are able to speak other languages beside English over a period of ten years,starting from 2000.
Overall,it can be seen that students who can not speak any other languages rather than English is leading the pie chart in both years.Another intereting fact is that the pupils who knew french and spanish in 2000,the number increased in 2010.
According to the pie chart,the students who were unable speak any other languages increased by 5% in 2010.The percantage was 30% in 2000.
The percentage of students who knew
AI examiner evaluation
| Criterion | Band |
|---|---|
| Task Achievement / Task Response | 3.5 |
| Coherence and Cohesion | 4.5 |
| Lexical Resource | 5.0 |
| Grammatical Range and Accuracy | 5.0 |
| Overall | 4.5 |
Task Achievement / Task Response: Band 3.5
The response identifies the chart topic and gives a relevant overview: students speaking no other language form the largest group in both years. It also correctly reports that this group rose from 30% to 35%. However, the overview contains a major factual error: French and Spanish did not both increase; French fell from 15% to 10%, and Spanish fell from 20% to 10%. The response ends mid-sentence after “The percentage of students who knew,” so most categories and comparisons are not reported, leaving the task only minimally addressed. It is also 56 words below the required minimum of 150, which contributes to the lack of coverage. Include the main changes across all categories and complete the summary.
Coherence and Cohesion: Band 4.5
There is a basic attempt to organise the response, beginning with an introduction, followed by an overview and then a detail paragraph. Linking expressions such as “Overall” and “According to the pie chart” help signal these stages. However, the progression is very limited: the final paragraph stops mid-sentence, and the response does not develop a clear comparison of the categories across the two years. Some punctuation spacing also makes the flow less smooth, as in “Overall,it” and “ten years,starting.” To improve, use separate, complete paragraphs for the overview and grouped data comparisons, and connect related figures with clear references such as “by contrast” or “while.”
Lexical Resource: Band 5.0
The response uses some relevant chart vocabulary, including “percentage,” “increased,” and “pie chart,” and the topic is generally understandable. However, the range is limited and several choices are inaccurate or awkward, such as “other languages beside English,” “is leading the pie chart,” and “the number increased” when referring to a percentage. “Pupils” is less suitable than “students” in this context, and “intereting” and “percantage” are misspelled. These errors make the description less precise, especially when reporting trends. Use standard data-reporting collocations such as “accounted for,” “rose to,” “fell from,” and “the proportion of students,” and check spelling carefully.
Grammatical Range and Accuracy: Band 5.0
The response attempts a few different sentence forms, including a complex opening clause and an overview introduced by “Overall.” However, control is uneven, and errors occur in basic sentence construction and agreement. For example, “students … those who are able” has an incorrect relative construction, while “students who can not speak … is leading” has subject–verb disagreement. The phrase “the pupils who knew french and spanish in 2000, the number increased” is also not a complete, well-formed comparison. Punctuation spacing is inconsistent, and the final sentence is unfinished. Aim for clear, complete sentences with a consistent past-tense frame for the chart data, and check that each subject matches its verb.
See this exact question answered at other band scores. The same prompt compared across bands.
Browse more IELTS Writing model answers or get your own writing scored by the same AI examiner.