Band 5.5 IELTS Writing Task 1 Model Answer
Overall Band Score: 5.5 · Cambridge IELTS 11 · 2026-11-17
IELTS Writing Task 1 question
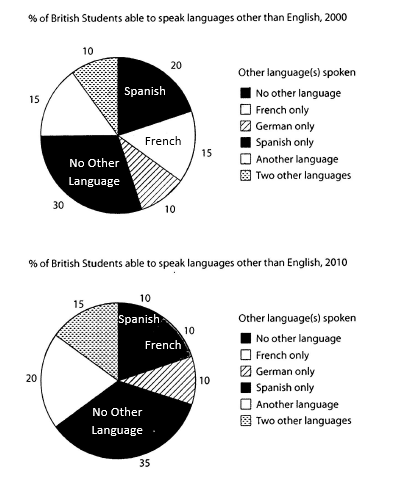
The charts below show the proportions of British students at one university in England who were able to speak other languages in addition to English, in 2000 and 2010
Summarise the information by selecting and reporting the main features, and make comparisons where relevant.
Student answer (Band 5.5)
the given pie charts illustrates the commparison of different languages that were spoke by british students of a university alongside of english in 2000 and 2010 in england.
overall,a major portion of students are not able to speak any other language however spanish,french, german and other languages are famous in different students in both years.
in 2000 30% of the students were only abale to speak english but there are 20% of the students speak in spanish along with the english furthur more french and another language were also spoke by 30% of the students 15% each additionally 10% students had german there secong language while speaking and rest of 10% students were able to speak two othher languages as well apart from english at a university in england .
on the other hand in 2010 again the major poortion of the students were not able to speak any other language other thhhan english they are about 35% which are 5% more in comparison of year 2000, the percentage of geman language remain the same as 2000 , its 10% of the students, but spanish language shows a dramatic decrease to its half then in 2000 which were 20% there are also 5% decrease in french as there were 15 % students those who can speak french as well but in 2010 there are only 10% of the students .however there is 5% increase in aother language from 2000 as in 2010 15% studnets can speak another language as well but if we talk about the two other languages they are decreased to 10% of the students who can speak other languages.
in conclusion in both year most number of the students are unable to speak other language french spanish and other language were also famous in rest of the students and popularity in german language remains te same in both years also two other languages were also belongs to some studnts .
AI examiner evaluation
| Criterion | Band |
|---|---|
| Task Achievement / Task Response | 5.5 |
| Coherence and Cohesion | 5.5 |
| Lexical Resource | 5.0 |
| Grammatical Range and Accuracy | 5.0 |
| Overall | 5.5 |
Task Achievement / Task Response: Band 5.5
You report most of the chart figures and identify relevant changes, including the rise in students speaking no other language from 30% to 35%, the fall in Spanish from 20% to 10%, and German remaining at 10%. However, the overview is not fully accurate: “a major portion” suggests a majority, although the largest category is only 30% in 2000 and 35% in 2010. The conclusion also repeats broad claims rather than highlighting the main pattern. There are specific data errors: in 2010, “another language” is 20%, not 15%, and “two other languages” is 15%, not 10%. Give a concise, accurate overview and check each comparison against the chart.
Coherence and Cohesion: Band 5.5
The response has an introduction, an overview, and separate paragraphs for the two years, so the reader can generally follow its organisation. You also use comparison signals such as “on the other hand,” “however,” and “in comparison.” However, the progression is weakened by long, crowded sentences that combine several figures and comparisons, especially in the 2000 paragraph. Some linking phrases do not clearly express the relationship between ideas, and the final conclusion largely repeats the overview instead of synthesising the changes. Grouping the categories into clear comparisons—for example, languages that declined versus those that increased—would make the information easier to follow. Use shorter sentences and ensure each paragraph has a distinct purpose.
Lexical Resource: Band 5.0
You use some relevant chart vocabulary, including “percentage,” “decrease,” “increase,” and “remain the same,” which helps communicate the comparisons. However, the range is limited and several word choices or collocations are inaccurate or repetitive. Phrases such as “languages were famous,” “speak in Spanish,” and “were able to speak two other languages” are not natural ways to describe these data. Spelling errors, including “commparison,” “abale,” “furthur,” and “studnets,” are frequent enough to distract the reader. Choose precise reporting language and check spelling carefully. For example, describe a category as “students who spoke Spanish” and say its proportion “fell by half,” rather than using less natural phrasing.
Grammatical Range and Accuracy: Band 5.0
You attempt longer sentences and use some subordinate clauses to compare the years, but the range of structures is limited and complex sentences are often difficult to control. Errors in agreement and verb forms appear in phrases such as “the given pie charts illustrates” and “languages that were spoke.” Sentence boundaries and punctuation are also unreliable: several sentences run on while joining multiple comparisons with commas or “but.” Articles and plural forms are sometimes missing or inconsistent, as in “the two other languages.” These errors can make relationships between figures harder to understand. Practise writing shorter, complete sentences with a clear subject and verb, then combine ideas using accurate clauses and punctuation.
See this exact question answered at other band scores. The same prompt compared across bands.
Browse more IELTS Writing model answers or get your own writing scored by the same AI examiner.