Band 5.0 IELTS Writing Task 1 Model Answer
Overall Band Score: 5.0 · Cambridge IELTS 11 · 2026-11-18
IELTS Writing Task 1 question
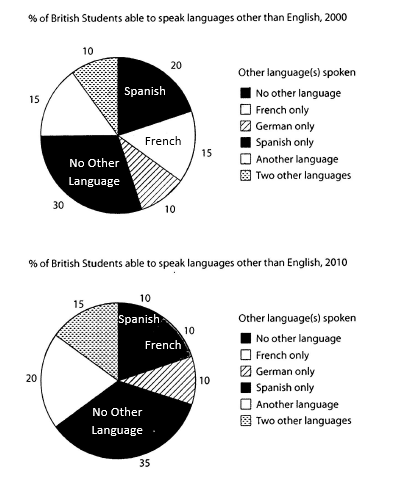
The charts below show the proportions of British students at one university in England who were able to speak other languages in addition to English, in 2000 and 2010
Summarise the information by selecting and reporting the main features, and make comparisons where relevant.
Student answer (Band 5.0)
The given pie charts demonstrates the proportions of British students at single university in England who were capable to speak different languages in addition to English, in two specific years.
Overall, six different categories are mentioned in both the charts.In both years, No other language accounted for the highest proportion in two charts, while German language comprises less percentages in both years spoke by british students.
To begin with,in 2000 category of no other language accounted the highest number of students and it was 30%.French and another language comprises the same number of students in 2000 and it was 15%.The number of students who able to speak in spanish was 20% which was the second highest in 2000. Only 10% students able to speak in German and two other language in the same year.
On the other hand, In the next mentioned year 2010, Spanish, French and German constituted the same number of students and it was only 10% fewer than the other languages.No other languages represented 35% of british students which was the highest.French,two other language and another language provides significant number of students it was 15% and 20%.
AI examiner evaluation
| Criterion | Band |
|---|---|
| Task Achievement / Task Response | 5.0 |
| Coherence and Cohesion | 5.5 |
| Lexical Resource | 5.0 |
| Grammatical Range and Accuracy | 5.0 |
| Overall | 5.0 |
Task Achievement / Task Response: Band 5.0
You identify the main overall pattern: “No other language” is the largest category in both years, and you report several relevant figures. However, the overview is incomplete and partly inaccurate: German was tied for the smallest share in 2000, but in 2010 German, French and Spanish were tied at 10%, so it was not consistently the smallest category. The 2010 account also becomes unclear: “only 10% fewer than the other languages” does not accurately describe the equal 10% shares, and the final sentence gives 15% and 20% without clearly matching each figure to its category. To make the summary more complete, clearly compare the main changes: Spanish fell from 20% to 10%, while “another language” and “two other languages” increased.
Coherence and Cohesion: Band 5.5
The response has a recognisable structure, with an introduction, an overview and separate paragraphs for 2000 and 2010. This helps the reader follow the broad time sequence. However, progression within the paragraphs is uneven, and some links between figures and categories are unclear. For example, “French, two other language and another language provides significant number of students it was 15% and 20%” does not make clear which values belong to which categories. The connectors “To begin with” and “On the other hand” signal sections, but the latter suggests a contrast that is not fully developed. Grouping categories by whether they rose, fell or stayed the same, and using clearer references for each figure, would strengthen the organisation.
Lexical Resource: Band 5.0
You use some relevant chart vocabulary, including “proportions,” “accounted,” “constituted” and “represented,” and the reader can generally identify the categories being discussed. However, the range is limited and several word choices or collocations are inaccurate, which sometimes makes the data difficult to interpret. For instance, “German language comprises less percentages” is not a natural way to describe a share, while “provided significant number of students” is imprecise. Category labels also vary between “No other language” and “No other languages,” reducing consistency. Use precise terms such as “share,” “proportion” and “accounted for,” and repeat the chart’s category names accurately when comparing figures.
Grammatical Range and Accuracy: Band 5.0
You attempt both simple and more extended sentence forms, and the response is usually understandable. However, errors in sentence structure, agreement, articles and punctuation occur frequently. Examples include “The given pie charts demonstrates,” where the plural subject needs a plural verb, and “students who able to speak,” which is missing a verb form. The sentence beginning “French, two other language and another language provides” also has agreement and sentence-structure problems, making the figures hard to follow. Several sentences run together without spaces after full stops or commas, such as “charts.In” and “To begin with,in.” Check subject–verb agreement, include necessary articles and auxiliary verbs, and separate each complete idea with accurate punctuation.
See this exact question answered at other band scores. The same prompt compared across bands.
Browse more IELTS Writing model answers or get your own writing scored by the same AI examiner.