Band 5.5 IELTS Writing Task 1 Model Answer
Overall Band Score: 5.5 · Cambridge IELTS 11 · 2026-11-18
IELTS Writing Task 1 question
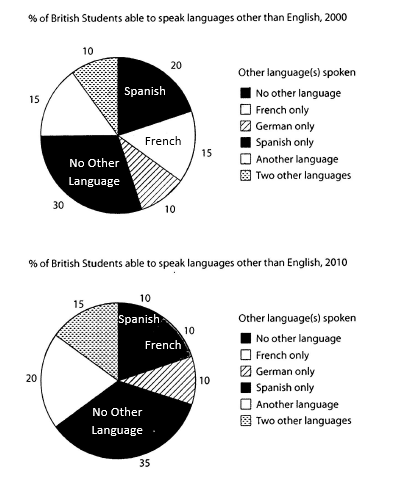
The charts below show the proportions of British students at one university in England who were able to speak other languages in addition to English, in 2000 and 2010
Summarise the information by selecting and reporting the main features, and make comparisons where relevant.
Student answer (Band 5.5)
The percentage of student in 2000 and 2010 who speak other languages in additions to english is discribe in the chart blow. The mojority of the studentsw in 2000 are those who cann't speak any other language there percentage was 30 but in 2010 it get increased from 30 to 35 while spanish speaker and france speakers both percetage decreases. The percentage of the people who speak german remaine same but students with two other languages have increased 5% eccept that the students with other languages also increased.
The percentage of students those don't speake other langiages has increased from 30% to 35% from 2000 to 2010 while the percentage of students who speake spanish was 20% in 2000 but in 2010it goes to 10%. Same the percentage of students those speak franch was 15% in 2000 but in 2010 it goes to 10%.
The percentage of the students who speak german in 2000 and 2010 reamin same 10% in all time. Whilethe percentage of the students those speak other languages then all of above is 15% in 2000 but it goes to 20% in 2010. On the other hands the students with two other languages was 10% in 2000 but it goes to 15% in 2010.
AI examiner evaluation
| Criterion | Band |
|---|---|
| Task Achievement / Task Response | 6.0 |
| Coherence and Cohesion | 5.0 |
| Lexical Resource | 5.0 |
| Grammatical Range and Accuracy | 5.0 |
| Overall | 5.5 |
Task Achievement / Task Response: Band 6.0
You report the main changes accurately: students speaking no other language rose from 30% to 35%, Spanish fell from 20% to 10%, French declined from 15% to 10%, and German remained at 10%. You also include the increases for another language and two other languages. This gives a relevant account of both charts. However, the opening says the majority spoke no other language, although this group was only 30% in 2000 and 35% in 2010, so it was the largest category rather than a majority. The overview is also embedded in the detail rather than clearly summarising the overall pattern. A concise overview identifying the largest category and the contrasting rises and falls would make the key features clearer; some comparisons are repeated without adding further insight.
Coherence and Cohesion: Band 5.0
The response has a basic structure, moving from a general opening to comparisons and then further category details. Repeating the figures in the second paragraph, however, creates an unclear overall progression: the changes in no other language, Spanish and French are stated twice. Linking phrases such as “while,” “same,” and “on the other hands” attempt to connect comparisons, but some are awkward or inaccurate, and several sentences run together. Grouping the categories by trend—for example, declines, increases, and no change—would make the information easier to follow. Use paragraphing to separate a clear overview from the supporting details, and avoid restating the same figures.
Lexical Resource: Band 5.0
You use relevant chart vocabulary, including “percentage,” “increased,” “decreases,” and “remained same,” so the reader can generally identify the comparisons. However, the range is limited and several word-choice, spelling, and word-form errors make the report less clear, such as “franch,” “langiages,” “eccept,” and “discribe.” Phrases such as “other languages then all of above” and “the percentage of the people” are imprecise or unnatural. Use the chart labels consistently, such as “students speaking another language” and “two other languages,” and choose precise trend verbs. Proofreading spelling and using natural collocations would improve clarity and control.
Grammatical Range and Accuracy: Band 5.0
You attempt both simple statements and longer comparisons, including “The percentage of students who speak German … remained the same” and sentences joined with “while” and “but.” However, grammatical control is uneven, and errors in sentence construction and verb forms recur. For example, “The majority of the students … are those” shifts tense, while “it get increased” and “it goes to 10%” use incorrect verb forms for describing past data. There are also problems with articles, agreement, and sentence boundaries, as in “The percentage of student … is discribe.” Use the past tense consistently for both years, check subject–verb agreement, and build shorter, complete comparison sentences before attempting more complex structures.
See this exact question answered at other band scores. The same prompt compared across bands.
Browse more IELTS Writing model answers or get your own writing scored by the same AI examiner.