Band 5.5 IELTS Writing Task 1 Model Answer
Overall Band Score: 5.5 · Cambridge IELTS 11 · 2026-11-18
IELTS Writing Task 1 question
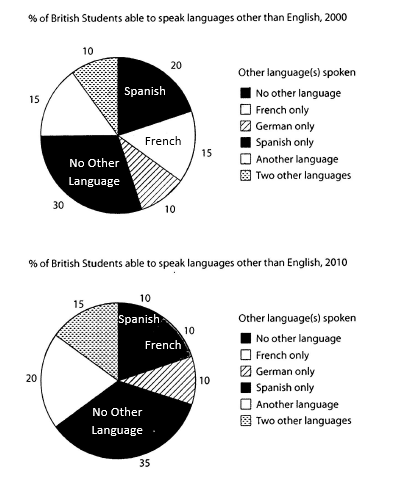
The charts below show the proportions of British students at one university in England who were able to speak other languages in addition to English, in 2000 and 2010
Summarise the information by selecting and reporting the main features, and make comparisons where relevant.
Student answer (Band 5.5)
The given bar charts illustrate of British students able to speak languages other then English at one university in England in 2000 and 2010.
Overall, students did not speak any other language had the highest proportion in both years. While students spoke German only had the lowest proportion, and the percantage was the same in 2000 and 2010.
In 2000,students did not speak any language stood at 30%, while the percentage in 2010 was 35%. Students spoke German only and two other languages represented for 10% in 2000. Compared by 2010, the percentage of students spoke just German and tow other languages accounted for 10% and 15% respectively.
Students spoke Spanish accounted for 20% in 2000, and 10% of students sopke Spanish in 2010. Wheares students spoke Franch contribute 15% in 2000, and in 2010 accounted for 20%. Finally, students sopke other languages represnted for 15% in 2000, in 2010 accounted for 20%.
AI examiner evaluation
| Criterion | Band |
|---|---|
| Task Achievement / Task Response | 5.5 |
| Coherence and Cohesion | 5.5 |
| Lexical Resource | 5.0 |
| Grammatical Range and Accuracy | 5.0 |
| Overall | 5.5 |
Task Achievement / Task Response: Band 5.5
You identify the main overall feature correctly: students with no other language formed the largest group in both years, rising from 30% to 35%. You also report several relevant figures, including Spanish falling from 20% to 10% and German remaining at 10%. However, some key comparisons are inaccurate: French fell from 15% to 10%, not rose to 20%, while “another language” increased from 15% to 20%. The overview also incorrectly calls German the smallest category; in 2000, German and two other languages were tied at 10%, and in 2010 German was the smallest at 10%. These errors and the limited synthesis mean the main features are only partly and unevenly covered. Check each figure against the chart before describing trends.
Coherence and Cohesion: Band 5.5
The response has a recognisable structure, with an introduction, an overview and two paragraphs of details. This helps the reader follow the comparison between 2000 and 2010. However, progression within the detail paragraphs is not always smooth: the second paragraph moves between categories, and the final paragraph lists figures without clearly grouping the increases and decreases. Linking phrases such as “Compared by 2010” and “Finally” are either awkward or do not clarify the relationship between the data. Some sentences also repeat the same “students spoke…” pattern, making the report feel list-like. Organise the details into clear groups—for example, categories that rose, fell or stayed unchanged—and use accurate comparison phrases to connect them.
Lexical Resource: Band 5.0
You use some task-relevant vocabulary, including “proportion,” “percentage,” “accounted for” and “represented,” so the topic is generally clear. However, the range is limited and several choices or forms are inaccurate, sometimes making the meaning less precise. For example, “represented for” is not a natural collocation, and “students did not speak any language” could be misunderstood as meaning they spoke no language at all rather than no language besides English. There are also noticeable spelling errors, including “percantage,” “tow,” “sopke,” “Wheares,” “Franch” and “represnted.” Use the chart’s category labels consistently and check spelling and collocations carefully; this will make the comparisons clearer and more appropriate for an academic report.
Grammatical Range and Accuracy: Band 5.0
You attempt both simple sentences and more complex comparisons, such as “While students spoke German only had the lowest proportion…” and “Compared by 2010…”. However, these attempts often contain faulty sentence structure, and many sentences omit necessary grammatical words. For instance, “The given bar charts illustrate of British students…” needs a complete verb pattern, while “students spoke German only and two other languages represented for 10%” does not form a clear grammatical sentence. The clauses beginning “While students…” and “Whereas students…” are also not properly connected to a main clause. Commas are missing after introductory phrases, as in “In 2000,students…”. Practise complete clause structures and accurate comparisons, then proofread punctuation and verb forms.
See this exact question answered at other band scores. The same prompt compared across bands.
Browse more IELTS Writing model answers or get your own writing scored by the same AI examiner.