Band 6.0 IELTS Writing Task 1 Model Answer
Overall Band Score: 6.0 · Cambridge IELTS 11 · 2026-11-19
IELTS Writing Task 1 question
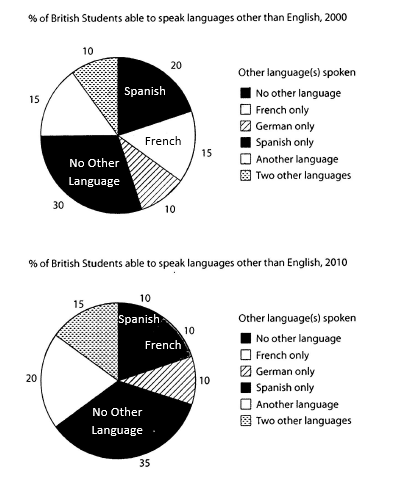
The charts below show the proportions of British students at one university in England who were able to speak other languages in addition to English, in 2000 and 2010
Summarise the information by selecting and reporting the main features, and make comparisons where relevant.
Student answer (Band 6.0)
The two pie charts compares the number of British Students who were able to speak languages other that English in the year 2000 and 2010.
Overall, maximum number of British Students were unable to speak any languages other than English where as smallest proportion of them were able to speak German in both years. Notably, French and Spanish were spoked by few proportion.
In both 2000 and 2010, majority of British Student speaks English only which which were accounted for 30% and 35% respectively. In 2000, 20% of British Student were able to speak Spanish, which later fell to 10% in 2010. A similar trend can be observed for French which fell to 10% from 15% in 2010.
In contrast around 10% of British Students were able to speak two other languages which later increased to 20% in 2010. Meanwhile German language accounted for 10% in both the period of time.
AI examiner evaluation
| Criterion | Band |
|---|---|
| Task Achievement / Task Response | 6.0 |
| Coherence and Cohesion | 6.5 |
| Lexical Resource | 5.5 |
| Grammatical Range and Accuracy | 5.5 |
| Overall | 6.0 |
Task Achievement / Task Response: Band 6.0
You identify the main overall pattern: the share reporting no other language rises from 30% to 35%, while Spanish and French decline. These comparisons are relevant and accurately reported. However, the overview is partly unclear: German is not the smallest category in both years, since German and two other languages are tied at 10% in 2000, and German is not the smallest in 2010. The statement that French and Spanish were spoken by a “few proportion” is also vague. Some data are omitted or misreported: “two other languages” rises from 10% to 15%, not 20%, and the figures for “another language” (15% to 20%) are not covered. A more precise overview and accurate reporting of these categories would make the summary more complete.
Coherence and Cohesion: Band 6.5
The response has a clear four-part structure, moving from an introduction and overview to comparisons across the two years. Linking expressions such as “Overall,” “In contrast,” and “Meanwhile” help signal the relationships between points, and the main progression is easy to follow. This is a sound organisational foundation. However, some connections are not fully logical: “In contrast” introduces an increase in the two-language category without a clear contrast with the preceding decline, and the overview’s comments about the smallest proportion are difficult to reconcile with the figures that follow. Repeated wording such as “British Students” also makes the flow somewhat mechanical. Use more precise references to categories and group related increases and decreases together.
Lexical Resource: Band 5.5
You use relevant chart vocabulary, including “proportion,” “accounted for,” “fell,” and “increased,” and the reader can generally understand the comparisons. However, several word-choice and collocation problems reduce precision: “maximum number” is unsuitable for percentages, “few proportion” is unnatural, and “spoked” is not the correct form for describing languages. “Unable to speak any languages other than English” is also less concise than the chart category “no other language.” Capitalisation of “Students” is inconsistent. Aim for accurate, natural phrases such as “the largest share,” “a smaller proportion,” and “were able to speak.” These improvements would make the vocabulary more controlled and appropriate to an academic data summary.
Grammatical Range and Accuracy: Band 5.5
You attempt a mix of simple statements and more developed comparisons, including the sentence beginning “In 2000” and the clause “which later fell to 10%.” Meaning is usually recoverable, but some grammatical errors remain. The opening should be “The two pie charts compare,” because the plural subject requires a plural verb. There are also agreement and tense problems in “majority of British Student speaks” and “which which were accounted for.” The phrase “A similar trend can be observed for French which fell” needs clearer clause structure, while “in both the period of time” has an incorrect article and number pattern. Check subject–verb agreement, avoid duplicated words, and use consistent past-tense forms when describing the chart years.
See this exact question answered at other band scores. The same prompt compared across bands.
Browse more IELTS Writing model answers or get your own writing scored by the same AI examiner.