Band 5.0 IELTS Writing Task 1 Model Answer
Overall Band Score: 5.0 · Cambridge IELTS 11 · 2026-11-19
IELTS Writing Task 1 question
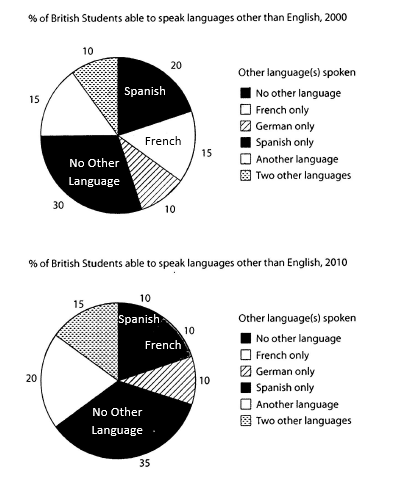
The charts below show the proportions of British students at one university in England who were able to speak other languages in addition to English, in 2000 and 2010
Summarise the information by selecting and reporting the main features, and make comparisons where relevant.
Student answer (Band 5.0)
The pie chart given below illustrates the proportions of British students at one university in England who were able to speak other languages apart from English, in 2000 and 2010.
Overall, only 10% were able to speak another language and 15% were able to speak two other languages, 30% students only speak English in 2000. In 2010, 35% students only speak native language , 20% students speak another language and 15% students speak two other languages in addition to English.
These pie charts compare the number of students who can speak different languages. In 2000, 30% students speak no other language, 10% speak German only, 15% speak french and another 15% speak anyother language, 20% speak spanish only and 10% students speak two other languages.
In 2010, the ratio changes as 35% students speak no other language , 10 % students speak only in french and spanish, 10% only german, 15% were able to speak two other languages and 20% students can speak other language.
In conclusion, the ratio of students not able to speak anyother language increased in 2010. The more students were also inclined to learn french in 2010 as compared to 2000. The number of students who can speak another language also increased in 2000 and 2010.
AI examiner evaluation
| Criterion | Band |
|---|---|
| Task Achievement / Task Response | 5.0 |
| Coherence and Cohesion | 5.0 |
| Lexical Resource | 5.0 |
| Grammatical Range and Accuracy | 5.0 |
| Overall | 5.0 |
Task Achievement / Task Response: Band 5.0
You identify the two years and report several relevant figures, including the rise in students speaking no other language from 30% to 35% and the increase in “another language” from 15% to 20%. However, the overview is not consistently accurate: “only 10% were able to speak another language” does not clearly identify a chart category, and the final claim that more students were inclined to learn French is incorrect, since French fell from 15% to 10%. The statement that students speaking another language increased “in 2000 and 2010” is also unclear. To make the response more complete, give a clear overview of the main changes and compare the categories accurately, including the unchanged German figure and the decline in Spanish.
Coherence and Cohesion: Band 5.0
The response has some organisation: it begins with an introduction, gives an overview, and then describes the figures for each year. This helps the reader locate the main information. However, progression is weakened by repetition: the overview and the later paragraphs repeat several of the same percentages without developing a clear comparison between years. The concluding paragraph also introduces claims that conflict with the data rather than bringing the comparison together. Linking phrases such as “In 2010” provide basic sequencing, but connections between related changes are limited. Organise the body around increases, decreases and unchanged figures, and use clear references to show which category each comparison concerns.
Lexical Resource: Band 5.0
You use enough topic vocabulary to communicate the general subject, including “proportions,” “speak,” “languages” and “increased.” However, the range is limited and several expressions are repetitive or imprecise, such as “speak another language” and “speak other language,” which can blur the distinction between the chart’s categories. “The ratio changes as” is not a natural way to introduce percentage data, and “inclined to learn French” suggests willingness or intention, which the chart does not measure. There are also spelling and form errors, including “french,” “spanish” and “anyother.” Use precise category labels such as “French only” and “two other languages,” and choose neutral reporting verbs such as “accounted for” or “rose.”
Grammatical Range and Accuracy: Band 5.0
The response uses mostly simple sentence patterns, with some attempts to combine information, but grammatical control is inconsistent. Errors in sentence construction and agreement appear in phrases such as “30% students only speak English” and “35% students speak native language”; these need an article or a different structure, for example, “30% of students spoke only English.” Tense also shifts between “were able,” “speak” and “can speak,” although the charts describe two past years. Punctuation spacing is uneven, and some long lists are joined without clear sentence boundaries. Practise accurate percentage constructions and maintain past tense throughout; adding a few controlled comparative clauses would also broaden the range.
See this exact question answered at other band scores. The same prompt compared across bands.
Browse more IELTS Writing model answers or get your own writing scored by the same AI examiner.