Band 4.0 IELTS Writing Task 1 Model Answer
Overall Band Score: 4.0 · Cambridge IELTS 11 · 2026-11-20
IELTS Writing Task 1 question
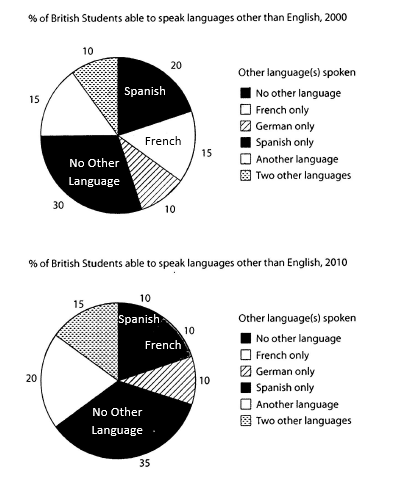
The charts below show the proportions of British students at one university in England who were able to speak other languages in addition to English, in 2000 and 2010
Summarise the information by selecting and reporting the main features, and make comparisons where relevant.
Student answer (Band 4.0)
The pie charts illustruate the proportions of British students at one university in England who could speak languages other than english in 2000 and 2010
Overall, the highest percentage of students spoke no other language in 2000, while spanish was the most common additional language. The lowest figures were recorded for German and two other languages in 2000, 30% of british stude
could not speak any language other than english spanish accounted for 20% of students, making it the secound
AI examiner evaluation
| Criterion | Band |
|---|---|
| Task Achievement / Task Response | 3.5 |
| Coherence and Cohesion | 3.0 |
| Lexical Resource | 5.5 |
| Grammatical Range and Accuracy | 4.5 |
| Overall | 4.0 |
Task Achievement / Task Response: Band 3.5
You identify the topic and make an attempt at an overview, noting that “no other language” was the largest category in 2000 and Spanish was the most common additional language. These points match the chart. However, the response is incomplete and reports very little of the data: it gives only a few 2000 figures, does not describe the 2010 chart, and ends mid-sentence at “making it the secound”. The claim that German and two other languages had the lowest figures in 2000 is also inaccurate: German and two other languages were both 10%, but they were not the only lowest categories, as French and another language were each 15%. The response is 69 words, below the 150-word minimum; 11 words copied from the prompt were excluded from that count. Include a complete overview and key comparisons for both years.
Coherence and Cohesion: Band 3.0
The opening sentence establishes the subject, and “Overall” signals an attempt to separate the overview from details. However, the response has no clear paragraph structure or progression beyond this brief start. The overview and figures run together, and the transition into “30% of british stude…” is unclear; the final phrase, “making it the secound”, is unfinished, so the reader cannot follow the intended point. There is also no organised comparison between 2000 and 2010. Use separate paragraphs for the overview and selected details, and group information by meaningful comparisons—for example, categories that rose, fell, or stayed unchanged. Complete each sentence and use clear references to the year and category.
Lexical Resource: Band 5.5
You use relevant task vocabulary such as “proportions”, “spoke”, “percentage”, and “additional language”, which helps communicate the chart topic. The range is nevertheless limited because the response is very short and repeats basic references to students and languages rather than describing changes across the two years. Several spelling and capitalisation errors are noticeable, including “illustruate”, “english”, “spanish”, “british”, and “secound”. These are lexical accuracy issues, not grammar errors. Build a wider set of precise chart expressions, such as “accounted for”, “rose to”, “fell from”, and “remained unchanged”, and check spelling and proper-noun capitalisation before submitting.
Grammatical Range and Accuracy: Band 4.5
The response includes a few understandable sentence patterns, including the opening description and the overview beginning “Overall, the highest percentage…”. However, the range is narrow, with little evidence of varied or controlled complex structures. The text also contains incomplete constructions: “30% of british stude” is cut off, and “making it the secound” has no completed clause. The final sentence therefore does not express a complete idea. Punctuation is also missing at the end of the opening sentence, and the response does not consistently separate ideas into complete sentences. Practise writing complete sentences with a clear subject and verb, then use accurate comparative structures such as “the proportion rose from…to…” to report the chart data.
See this exact question answered at other band scores. The same prompt compared across bands.
Browse more IELTS Writing model answers or get your own writing scored by the same AI examiner.