Band 5.5 IELTS Writing Task 1 Model Answer
Overall Band Score: 5.5 · Cambridge IELTS 11 · 2026-11-20
IELTS Writing Task 1 question
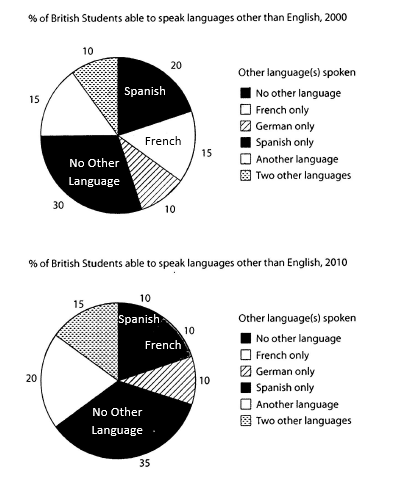
The charts below show the proportions of British students at one university in England who were able to speak other languages in addition to English, in 2000 and 2010
Summarise the information by selecting and reporting the main features, and make comparisons where relevant.
Student answer (Band 5.5)
The given charts illustrates the number of students in a university in England who can speak other languages instead of English in 2000 and 2010.
Overall, it is noted that a majority of students can speak no other language and also numerous students can speak spanish. Decent number of students can speak French and another language as well and some students can speak German and two other languages.
Firstly, in 2000 30% of students in university can not speak other languages instead of english and 20% of students can speak French, though no other language remains highest among both charts. On the other hand French only is 15% among the students, another language is also 15%. German only and two other languages stayed at 10%.
Secondly, in 2010 35% of student can not speak other languages instead of English which icreased by 5% than 2000 and Spanish only declined by 10%, remained only 10% in 2010. Another language made an increase of 5% and finally reached at 20% in 2010. French only also increased by 5% and reached 15% in 2010. German only remained same at 10% in both 2000 and 2010.
AI examiner evaluation
| Criterion | Band |
|---|---|
| Task Achievement / Task Response | 5.5 |
| Coherence and Cohesion | 6.0 |
| Lexical Resource | 5.5 |
| Grammatical Range and Accuracy | 5.5 |
| Overall | 5.5 |
Task Achievement / Task Response: Band 5.5
You identify the broad pattern that the share speaking no other language was largest, and you report several relevant changes, including the rise in “No Other Language” from 30% to 35% and the fall in Spanish from 20% to 10%. However, some figures are misreported: in 2000, 20% refers to Spanish, not French; French was 15%. In 2010, French fell to 10%, rather than increasing to 15%. The overview also says Spanish was numerous without clearly summarising the main shifts. Include the key categories accurately and compare both years consistently; this would make the report more complete and reliable.
Coherence and Cohesion: Band 6.0
The response has a clear overall arrangement: an introduction, an overview, and separate paragraphs for 2000 and 2010. Sequencing with “Firstly” and “Secondly” makes the year-by-year structure easy to follow, and most figures are placed in a sensible order. However, the overview is broad and does not clearly preview the main changes, while the repeated “can speak” phrasing makes the report feel list-like. Some connections are also awkward, such as “though no other language remains highest among both charts,” which does not clearly link the comparison. Grouping categories by whether they rose, fell, or stayed stable would create smoother progression and less mechanical cohesion.
Lexical Resource: Band 5.5
You use relevant chart vocabulary, including “declined,” “increased,” “reached,” and “remained,” so the reader can understand the intended comparisons. However, the range is limited and several phrases are imprecise or unnatural, such as “speak other languages instead of English,” “Decent number,” and “made an increase.” Repetition of “students can speak” also reduces flexibility. There are spelling and capitalisation slips, including “spanish,” “english,” and “icreased.” Use precise terms such as “were able to speak,” “accounted for,” and “rose by five percentage points,” and check spelling and language names to make the report more accurate and natural.
Grammatical Range and Accuracy: Band 5.5
You attempt some complex forms, for example “which increased by 5% than 2000,” and use time references to distinguish the two years. However, sentence structures are mostly simple or joined with basic connectors, and some grammatical errors affect clarity. In “The given charts illustrates,” the plural subject requires “illustrate”; “30% of students … can not speak” needs a past form for 2000; and “35% of student” requires a plural noun. The clause “which increased by 5% than 2000” is also not formed correctly. Practise accurate past-tense comparisons and plural agreement, and vary sentence patterns while keeping each comparison grammatically complete.
See this exact question answered at other band scores. The same prompt compared across bands.
Browse more IELTS Writing model answers or get your own writing scored by the same AI examiner.