Band 5.0 IELTS Writing Task 1 Model Answer
Overall Band Score: 5.0 · Cambridge IELTS 11 · 2026-11-21
IELTS Writing Task 1 question
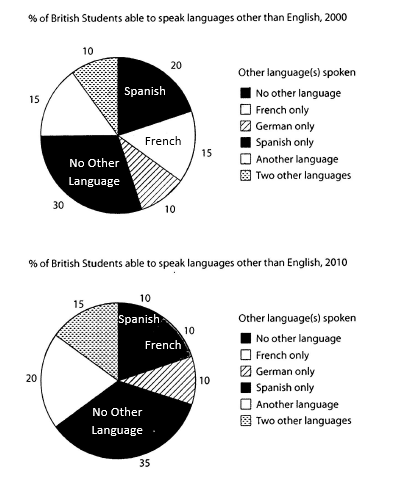
The charts below show the proportions of British students at one university in England who were able to speak other languages in addition to English, in 2000 and 2010
Summarise the information by selecting and reporting the main features, and make comparisons where relevant.
Student answer (Band 5.0)
The provided pie charts illustrate the information about the proportion of british students at a university in England who can speak many languages moreover english from 2000 to 2010
Overall it is evident that in the both pie charts, no other language stood at highest point whereas lowest is seen in two other languages
In detail, the no other language followed the incilne trend which was 3. Furthermore, french was at quarter and the German language was 10.Moreover, it was 20 in the spanish language. Similarly in the other language it declined by 10. However, it stood 15 in two other languages
Analysis remain data , no other language followed the same trend as the first pie chart it was also stood at highest point 35 and it was 10 in the french language. Similarly German language was also stood at 10.and it was 10 in the spanish language too. Meanwhile it increased by 5 which was 10 to 15. In the similar context it rose by 5 (15 to 20).
AI examiner evaluation
| Criterion | Band |
|---|---|
| Task Achievement / Task Response | 4.5 |
| Coherence and Cohesion | 5.0 |
| Lexical Resource | 5.0 |
| Grammatical Range and Accuracy | 5.0 |
| Overall | 5.0 |
Task Achievement / Task Response: Band 4.5
You identify the charts’ subject and provide an overview that correctly notes that students speaking no other language formed the largest group in both years. You also report several figures accurately, including 30% and 35% for this group, and 10% for German in both years. However, the account is only partially effective because some comparisons are unclear or inaccurate: “lowest is seen in two other languages” is not true for 2010, when Spanish is also 10%, and “French was at quarter” does not match the 15% figure. The description of changes is also difficult to follow, particularly “it declined by 10.” Select the main rises and falls, state the figures clearly, and compare the two years directly to make the report more complete and reliable.
Coherence and Cohesion: Band 5.0
The response has a basic structure: an introduction, an overview, and separate discussion of the two charts. This gives the reader some sense of how the information is organised. However, progression between points is not consistently clear. Phrases such as “Analysis remain data” and “same trend as the first pie chart” do not establish a clear relationship between the information that follows, while “Similarly” and “Moreover” are repeated without always showing the intended connection. Some references, including “it” in “it declined by 10,” are difficult to identify. Organise the details around comparisons between 2000 and 2010, and use clear references such as “the proportion speaking another language” rather than relying on “it.”
Lexical Resource: Band 5.0
You use some relevant vocabulary for describing charts, including “proportion,” “increased,” “declined,” and “highest point.” These choices show an attempt to report trends rather than simply list categories. However, the range is limited and several expressions are inaccurate or unnatural, which sometimes makes the intended meaning difficult to understand. For example, “followed the incilne trend” appears to mean “increased,” but the figure for no other language rose from 30% to 35%; “French was at quarter” is not an appropriate way to report 15%; and “many languages moreover english” is unclear. Use precise terms such as “accounted for,” “rose by five percentage points,” and “the smallest shares” to describe the data accurately.
Grammatical Range and Accuracy: Band 5.0
You attempt a mixture of simple statements and longer sentences, and the opening “The provided pie charts illustrate…” communicates the general topic. However, grammatical control is inconsistent, and errors in sentence structure, verb forms, articles, and punctuation often make the details hard to follow. Examples include “in the both pie charts,” “no other language stood at highest point,” and “it was also stood at highest point 35.” The sentence “Similarly German language was also stood at 10.and it was 10 in the spanish language too” also needs clearer punctuation and grammatical construction. Practise forming direct comparison sentences with accurate subjects and verbs, for example, “The proportion with no other language rose from 30% to 35%.”
See this exact question answered at other band scores. The same prompt compared across bands.
Browse more IELTS Writing model answers or get your own writing scored by the same AI examiner.