Band 4.5 IELTS Writing Task 1 Model Answer
Overall Band Score: 4.5 · Cambridge IELTS 11 · 2026-11-21
IELTS Writing Task 1 question
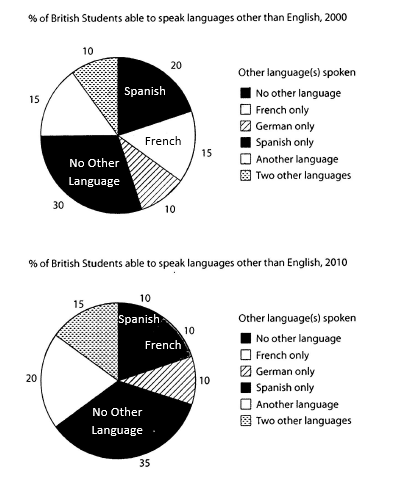
The charts below show the proportions of British students at one university in England who were able to speak other languages in addition to English, in 2000 and 2010
Summarise the information by selecting and reporting the main features, and make comparisons where relevant.
Student answer (Band 4.5)
This bar graph show's, percent of the england university students, speak other languages and comparison between 2000 to 2010.
In 2000, firstly, i see a names of other language's spoken on the right sight . On the left side, i see a languages percent. The first one is, no other language is on 30% spoken, french only is 15%, greman only is 10%, spanish only is 20 %, another languages is 15%, and two other languages is 10% spoken.
In 2010, firstly, i see a names of other language's spoken on the right sight . On the left side, i see a languages percent. The first one is, no other language is on 35 % spoken, french only is 10 %, greman only is 10 %, spanish only is 10 %, another languages is 20%, and two other languages is 15% spoken.
In 2010, some laguage decreses and some are increased. In increased spokens are, no other language, another language, and french only. And in decreasing language is, spanish, french.
From an overall prepective, it is erident that, some languages are increased and some are decreased.
AI examiner evaluation
| Criterion | Band |
|---|---|
| Task Achievement / Task Response | 4.5 |
| Coherence and Cohesion | 5.0 |
| Lexical Resource | 4.5 |
| Grammatical Range and Accuracy | 4.5 |
| Overall | 4.5 |
Task Achievement / Task Response: Band 4.5
You report most of the chart figures accurately, including the 2000 and 2010 proportions for no other language, German, Spanish, and the other categories. However, the overview is vague: “some languages are increased and some are decreased” does not identify the main pattern that the share speaking no other language rose, while Spanish-only fell notably. There is also a key contradiction in your trend summary: you list “french only” among the increases, although it fell from 15% to 10%; French is then also named as decreasing. The response describes the figures but does not clearly select and compare the most important features. A more focused overview and accurate comparison of the largest changes would make the report more complete.
Coherence and Cohesion: Band 5.0
The response has a basic structure, with separate paragraphs for 2000, 2010, and a concluding overview, so the reader can generally follow the order of information. However, progression is limited by repeating almost the same framing—“firstly, i see” and “On the left side”—for both years, which describes the chart layout rather than developing comparisons. The final paragraph repeats the general idea that some figures rose and others fell without adding a clear summary. Linking is also sometimes confusing: the trend paragraph says French both increased and decreased. Organise the report around an overview followed by grouped comparisons, and use concise links such as “by contrast” or “while” to show how the figures relate.
Lexical Resource: Band 4.5
Your vocabulary is sufficient to name the chart categories and communicate basic changes, using terms such as “percent,” “increased,” and “decreasing.” However, the range is basic and repetitive, and several inaccurate or misspelled expressions make the report less clear, including “greman,” “laguage,” “decreses,” and “erident.” Phrases such as “other language’s spoken” and “increased spokens” are not natural ways to describe the data. Use standard chart-reporting collocations and precise verbs, for example, “the proportion speaking no other language rose” or “the figure for Spanish-only speakers fell.” Check spelling and avoid repeatedly using “I see,” which is not appropriate for an objective report.
Grammatical Range and Accuracy: Band 4.5
Most sentences use simple patterns, and the reader can understand the figures, but grammatical errors are frequent and sometimes make relationships unclear. The opening, “This bar graph show's, percent of the england university students,” has problems with sentence construction, articles, capitalization, and possessive form. In “some laguage decreses and some are increased,” the tense and verb forms are not controlled; the report should consistently describe the chart in the past, such as “some categories increased while others decreased.” There are also repeated awkward sentence fragments, including “The first one is, no other language is on 30% spoken.” Practise complete comparative sentences and accurate past-tense forms, and use punctuation to separate clauses rather than inserting commas after introductory phrases.
See this exact question answered at other band scores. The same prompt compared across bands.
Browse more IELTS Writing model answers or get your own writing scored by the same AI examiner.