Band 5.5 IELTS Writing Task 1 Model Answer
Overall Band Score: 5.5 · Cambridge IELTS 11 · 2026-11-22
IELTS Writing Task 1 question
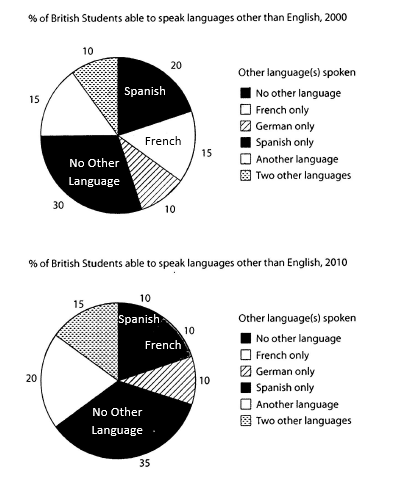
The charts below show the proportions of British students at one university in England who were able to speak other languages in addition to English, in 2000 and 2010
Summarise the information by selecting and reporting the main features, and make comparisons where relevant.
Student answer (Band 5.5)
The pie chart illustrates the proportions of english student at one instutation in england who are able to speak other languages to english in 2000 and 2010.
Looking from the overall prespective spanish languages spoken mostly in this two year. Moreover german language is spoken least then other languages in two years.
In 2000 spanish languages is spoken more and it cover 20 percentage. we can see in 2000 french and german language is least using student as compare to spanish french cover 15 percentage and german cover 10 percentage as a whole chart. additonally no other language sopken by english student is 30 percentage.
In 2010 there is a slight change as compare to perivious year we can clearly see that no other language spoken by british children is grow and become 35 percentage. in 2010 french also increase and become 20 percentage. furthermore spanish language is covering 10 percentage of pie chart and there is a 15 percentage cover by two other languages.
AI examiner evaluation
| Criterion | Band |
|---|---|
| Task Achievement / Task Response | 5.5 |
| Coherence and Cohesion | 5.5 |
| Lexical Resource | 5.0 |
| Grammatical Range and Accuracy | 5.0 |
| Overall | 5.5 |
Task Achievement / Task Response: Band 5.5
You identify the two years and report several relevant figures, including Spanish at 20% in 2000, no other language at 30% in 2000 and 35% in 2010, and two other languages at 15% in 2010. However, the overview is not accurate: Spanish was not the most common category in both years, since “no other language” was largest in 2010. The claim that German was the least common in both years is also incomplete, as it tied with two other languages in 2000 and with French and Spanish in 2010. In addition, French fell from 15% to 10%, rather than increasing to 20%. Select the main changes accurately and compare the categories across both charts more fully.
Coherence and Cohesion: Band 5.5
The response has a recognisable structure, with an introduction, an overview and separate paragraphs for 2000 and 2010. This helps the reader follow the broad time sequence. However, progression within the paragraphs is limited, and some comparisons are difficult to interpret, such as “french and german language is least using student as compare to spanish french.” Linking expressions such as “Moreover,” “additonally” and “furthermore” are used, but they do not always clarify how the figures relate; some feel mechanical. Improve cohesion by grouping categories that rise, fall or remain unchanged, and use clear comparison phrases such as “by contrast” or “while” to connect the data.
Lexical Resource: Band 5.0
You use some task-relevant vocabulary, including “proportions,” “percentage,” “slight change” and “cover,” so the topic is generally understandable. However, the range is limited and several word choices or collocations are inaccurate, for example “spanish languages spoken mostly,” “least using student” and “cover 20 percentage.” Repeated use of “spoken” and “percentage” also makes the description less precise. Spelling errors such as “instutation,” “prespective,” “additonally” and “perivious” are noticeable and can distract the reader. Build a more accurate set of chart-description phrases, including “accounted for,” “stood at,” “the largest category” and “declined,” and check spelling before submitting.
Grammatical Range and Accuracy: Band 5.0
The response mainly uses simple statements and attempts a few longer structures, such as “we can clearly see that no other language spoken by british children is grow and become 35 percentage.” However, errors are frequent and sometimes make relationships between ideas unclear. Examples include subject–verb agreement in “spanish languages is spoken,” tense and verb-form problems in “is grow and become,” and missing or incorrect articles in “in 2000 spanish languages.” Sentence boundaries and capitalisation are also inconsistent. Practise accurate present and past forms for describing chart data, and check that each sentence has a clear subject and correctly formed verb. More reliable simple sentences would improve clarity before you add complex structures.
See this exact question answered at other band scores. The same prompt compared across bands.
Browse more IELTS Writing model answers or get your own writing scored by the same AI examiner.