Band 5.5 IELTS Writing Task 1 Model Answer
Overall Band Score: 5.5 · Cambridge IELTS 15 · 2026-11-05
IELTS Writing Task 1 question
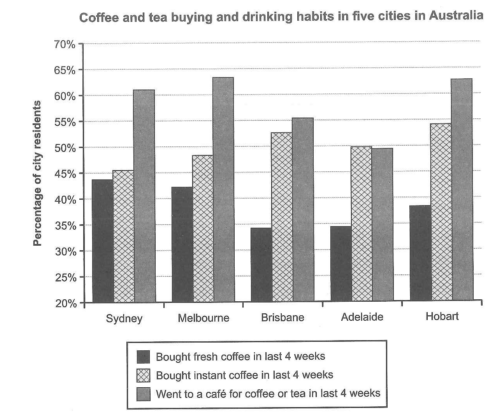
The chart below shows the results of a survey about people’s coffee and tea buying and drinking habits in five Australian cities.
Summarize the information by selecting and reporting the main features, and make comparisons where relevant.
Student answer (Band 5.5)
The given bar graph illustrates the outcomes of a survey about people’s coffee and tea buying and drinking habits in five Australian cities.
Overall, percentage of people in Melbourne and Hobart who went to cafe for coffee or tea in last four are at highest rate ehile residents of Brisbane and Adelaide who bought fresh coffee in last four weeks are at lowest level.
To begin with individuals who go to cafe for coffee and tea in recent weeks were highest in Melbourne and Hobart about 63%, then little bit low in Sydney apparently 61% then lower in Brisbane 55% and Adelaide 47%. Now observing the people who purchased fresh coffee in last 4 weeks. Residents of Sydney are at much level approximately 44% while in other cities like Melbourne and Hobart it is at low levels about 42% and 37% however, percentage of residence in Brisbane and Adelaide is same respectively.
Talking about the persons who bought instant coffee in recent days the rate is higher in Hobart about 55% low in other cities of Australia between 47% to 52% while lowest in Sydney like 45%.
AI examiner evaluation
| Criterion | Band |
|---|---|
| Task Achievement / Task Response | 5.5 |
| Coherence and Cohesion | 5.5 |
| Lexical Resource | 5.5 |
| Grammatical Range and Accuracy | 5.0 |
| Overall | 5.5 |
Task Achievement / Task Response: Band 5.5
You cover all three survey categories and include a useful overview that café visits were highest in Melbourne and Hobart, while fresh-coffee purchases were lowest in Brisbane and Adelaide. Most comparisons are grounded in the chart, including Sydney’s fresh-coffee figure and Hobart’s high instant-coffee figure. However, the overview is difficult to interpret, and some details are inaccurate or unclear: Melbourne and Hobart are not both exactly 63% for café visits, and Adelaide’s café figure is about 49.5%, not 47%. The statement that instant coffee was “low in other cities” also obscures the relatively high figures in Melbourne, Brisbane and Adelaide. Report the main patterns more precisely and make the comparisons clearer.
Coherence and Cohesion: Band 5.5
The response has a basic overall structure: an introduction, an overview and separate discussion of café visits, fresh coffee and instant coffee. This helps the reader identify the three categories, and phrases such as “To begin with” and “Talking about” signal transitions. However, the progression is somewhat mechanical, and the overview sentence is hard to follow because several comparisons are compressed into one sentence. Some links between ideas are also unclear, particularly “while in other cities like Melbourne and Hobart it is at low levels” and “however, percentage of residence in Brisbane and Adelaide is same respectively.” Use clearer topic sentences and connect each comparison directly to the relevant city and figure. This would make the organisation more coherent and reduce the need for the reader to infer relationships.
Lexical Resource: Band 5.5
You use relevant vocabulary for describing survey results, including “percentage,” “purchased,” “approximately” and “rate,” and you vary some wording rather than repeating the chart labels throughout. However, the range is limited and several choices or combinations are unnatural, such as “at highest rate,” “at much level,” “low in other cities” and “in recent days” for a four-week period. These expressions sometimes make the intended comparison less precise. There are also spelling and word-form slips, including “ehile” and “residence” where you mean residents. Aim for standard chart-reporting collocations and use precise verbs such as “accounted for,” “stood at” or “recorded,” while checking that each phrase accurately describes the data.
Grammatical Range and Accuracy: Band 5.0
You attempt both simple statements and longer sentences with contrast, for example the sentence beginning “Residents of Sydney…” and the clause introduced by “however.” This shows some structural variety, but control is inconsistent, and errors sometimes make relationships difficult to follow. Examples include the missing article and awkward construction in “percentage of people in Melbourne and Hobart who went to cafe,” the incomplete time phrase “in last four,” and the unclear agreement and structure in “percentage of residence in Brisbane and Adelaide is same respectively.” Punctuation and spacing are also uneven. Practise building accurate comparison sentences with a clear subject and verb, such as “The proportion in Brisbane and Adelaide was the same, at about 34.5%.” Check articles, plurals and sentence boundaries before submitting.
See this exact question answered at other band scores. The same prompt compared across bands.
Browse more IELTS Writing model answers or get your own writing scored by the same AI examiner.