Band 5.5 IELTS Writing Task 1 Model Answer
Overall Band Score: 5.5 · Cambridge IELTS 15 · 2026-11-06
IELTS Writing Task 1 question
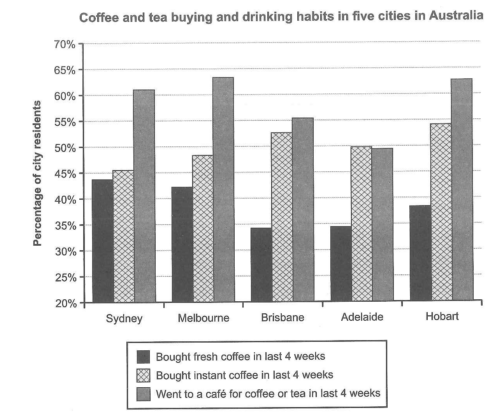
The chart below shows the results of a survey about people’s coffee and tea buying and drinking habits in five Australian cities.
Summarize the information by selecting and reporting the main features, and make comparisons where relevant.
Student answer (Band 5.5)
The bar chart illustrates the results of a survey about people’s coffee and tea buying and drinking habits in Sydney, Melbourne, Brisbane, Adelaide and Hobart.
Overall, it is clear that the largest number of people went to a cafe for coffee or tea as compared with others. While some residents who bought a fresh coffee showed downward trend, some people had instant coffee relatively increased in all cities.
Looking at the details, 65% of residents who visited the cafe for tea and coffee in last 4 weeks in Hobart and Melbourne respectively. This was followed by 61% of people enjoyed coffee at cafe in Sydney, whereas 56% in Brisbane and 49% in Adelaide.
However, the mostly people preffered to have instant coffee 45% in Sydney, 48% in Melbourne, 53% in Brisbane but after that the figure declined 3% and reached 50% in adelaide and increased in Hobart. The least number of people who had instant coffee 43% to 35% in all cities.
AI examiner evaluation
| Criterion | Band |
|---|---|
| Task Achievement / Task Response | 5.0 |
| Coherence and Cohesion | 5.5 |
| Lexical Resource | 5.5 |
| Grammatical Range and Accuracy | 5.0 |
| Overall | 5.5 |
Task Achievement / Task Response: Band 5.0
You identify the chart’s subject and give an overview that café visits were generally the most popular option. However, the response only partially reports the key features: it does not give fresh-coffee figures accurately or clearly, and the final sentence appears to describe fresh coffee while calling it instant coffee. The chart shows fresh coffee at about 34.5–44%, not “43% to 35% in all cities”; instant coffee is highest in Hobart, at about 54.5%, a comparison you do not complete. Café figures are broadly close, though Melbourne and Hobart are reversed in the wording and their values are slightly overstated. The response is also three words below the 150-word minimum. Include a clearer overview and accurate comparisons across all three categories.
Coherence and Cohesion: Band 5.5
The response has a recognisable structure: an introduction, an overview and two detail paragraphs. This gives the reader a basic route through the information, and phrases such as “Overall” and “Looking at the details” signal the sections. However, progression is weakened by unclear references and abrupt comparisons. For example, “This was followed by 61%” does not clearly identify which city or category is being compared, while “The least number of people who had instant coffee 43% to 35% in all cities” is difficult to connect to the preceding figures and seems to switch categories. Use one paragraph for café attendance and another for fresh and instant coffee, grouping cities by meaningful similarities and using clear references.
Lexical Resource: Band 5.5
You use relevant topic vocabulary, including “survey,” “residents,” “visited the cafe,” and “instant coffee,” and the meaning is generally recoverable. However, the range is limited and several word-choice, collocation and spelling problems make the report less precise. “The mostly people” is not a natural way to describe the largest proportion, and “enjoyed coffee at cafe” is less suitable for reporting survey behaviour than a neutral description of attendance. There are also spelling errors in “preffered” and “adelaide.” Aim for accurate, consistent chart language and avoid implying preferences or enjoyment when the data only records actions.
Grammatical Range and Accuracy: Band 5.0
You attempt both simple and more complex forms, including the contrast in “While some residents …, some people …,” and the overall meaning can usually be followed. However, errors occur frequently, and some sentence structures are incomplete or difficult to interpret. “65% of residents who visited the cafe … in Hobart and Melbourne respectively” lacks a clear main clause and does not match the order of the figures. In “the figure declined 3% and reached 50%,” the grammatical relationship between the change and the final value is unclear. Articles and prepositions are also inconsistent, as in “in last 4 weeks” and “at cafe.” Practise complete, direct sentences with clear subjects and accurate verb forms when reporting figures.
See this exact question answered at other band scores. The same prompt compared across bands.
Browse more IELTS Writing model answers or get your own writing scored by the same AI examiner.