Band 5.5 IELTS Writing Task 1 Model Answer
Overall Band Score: 5.5 · Cambridge IELTS 15 · 2026-11-06
IELTS Writing Task 1 question
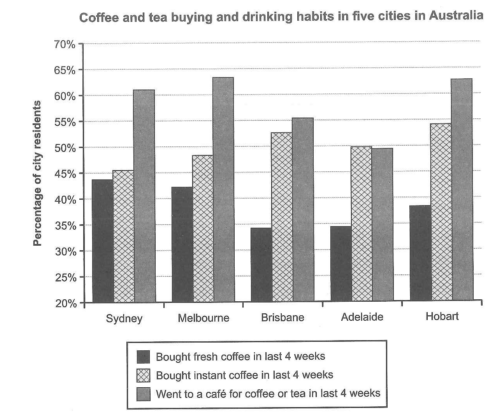
The chart below shows the results of a survey about people’s coffee and tea buying and drinking habits in five Australian cities.
Summarize the information by selecting and reporting the main features, and make comparisons where relevant.
Student answer (Band 5.5)
The bar graph illusrates the survey data about individuals coffee and tea buying and drinking habits in five diffrent Austrailian cities - Sydney,Melbourne,Brisbane,Adelaide and Hobart.
Firstly in sydney 61% went to a cafe for coffeeor tea,further 40% bought instant coffee and 44% buy fress coffee in last 4 weeks.
On the other hand in Melbourne 64% went to cafe for coffee or 47% instant coffee and 42% bought fresh coffee.
In Brisbane or Adelaide buying fresh coffee are similar stay at 34% but bought instant coffee have slightly difference 53% or 50% respectively.further gone to cafe for tea in brisbane 55.5% and in adelaide is 49%.
lastly in hobart went to cafe for tea is 62% while bought instant coffee is 54% and fresh coffee is 33% in last 4 week.
Overall went to cafe for coffee for is dominate then other and secondly instant coffee are on second position in five different australain cities and low ratio of fresh coffee in all cities of austalia in last four weeks.
AI examiner evaluation
| Criterion | Band |
|---|---|
| Task Achievement / Task Response | 5.5 |
| Coherence and Cohesion | 6.0 |
| Lexical Resource | 5.0 |
| Grammatical Range and Accuracy | 5.0 |
| Overall | 5.5 |
Task Achievement / Task Response: Band 5.5
You cover all three activities across the five cities and include several relevant comparisons, such as the similar fresh-coffee figures for Brisbane and Adelaide. However, some figures are inaccurate: Sydney’s instant-coffee figure is about 45.5%, not 40%; Melbourne’s is about 48.5%, not 47%; and Hobart’s fresh-coffee figure is about 38.5%, not 33%. The overview identifies café visits as the leading activity overall, but saying fresh coffee has a “low ratio” in every city is imprecise, and the ranking is not consistent in Sydney, where instant coffee slightly exceeds café visits? In fact, café visits are highest there too. To strengthen the response, report the main patterns accurately and make the overview more precise, including that café visits are highest in each city while instant coffee exceeds fresh coffee in all five.
Coherence and Cohesion: Band 6.0
The response has a recognisable structure: an introduction, city-by-city details, and a concluding overview. Grouping Brisbane and Adelaide together is useful because their fresh-coffee figures are similar, and transitions such as “Firstly,” “On the other hand,” and “lastly” help signal movement through the data. However, the progression is somewhat mechanical and the city-by-city listing makes comparisons across the whole chart less clear. Some links are awkward or unclear, particularly “further gone to cafe for tea” and the final overview sentence. Organise the body around the main comparisons—for example, café attendance, then fresh versus instant coffee—and use clearer linking phrases to show contrasts and rankings.
Lexical Resource: Band 5.0
You use relevant task vocabulary, including “survey data,” “bought instant coffee,” “fresh coffee,” and “went to a cafe,” so the reader can generally understand the categories being compared. However, the range is limited and several word-choice or collocation problems reduce precision: “low ratio” is not natural for describing a percentage, “on second position” is awkward, and “went to cafe for tea” does not accurately reflect the chart’s combined coffee-or-tea category. There are also noticeable spelling errors, including “illusrates,” “diffrent,” “Austrailian,” and “fress.” Learn and reuse accurate chart language such as “the proportion of residents,” “recorded the highest figure,” and “visited a café for coffee or tea.”
Grammatical Range and Accuracy: Band 5.0
You attempt both simple statements and longer comparisons, and the reader can usually follow the intended meaning. However, grammatical control is inconsistent, especially in sentence construction and verb forms. For example, “buying fresh coffee are similar stay at 34%” lacks a clear grammatical structure, while “in Hobart went to cafe for tea is 62%” has an incorrect subject and verb pattern. Articles and plurals are also often missing, as in “went to cafe” and “in last 4 week,” and punctuation is inconsistent, with several sentences joined by commas. Practise complete comparison structures, such as “The proportion who bought fresh coffee was similar in Brisbane and Adelaide,” and check subject–verb agreement, articles, and sentence boundaries.
See this exact question answered at other band scores. The same prompt compared across bands.
Browse more IELTS Writing model answers or get your own writing scored by the same AI examiner.