Band 5.5 IELTS Writing Task 1 Model Answer
Overall Band Score: 5.5 · Cambridge IELTS 15 · 2026-11-06
IELTS Writing Task 1 question
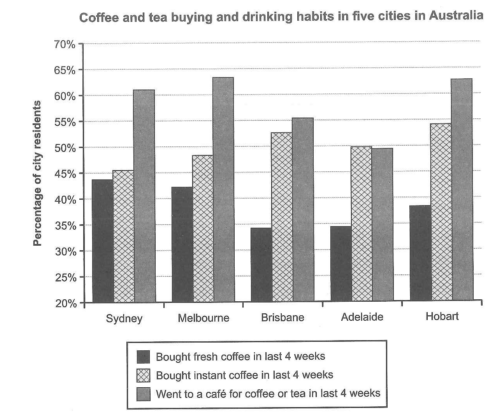
The chart below shows the results of a survey about people’s coffee and tea buying and drinking habits in five Australian cities.
Summarize the information by selecting and reporting the main features, and make comparisons where relevant.
Student answer (Band 5.5)
The bar chart compared the result of a last four week survey conducted in five different cities of Australia about residents habit of buying and drinking tea and coffee.
Overall, in every city people who goes to a cafe for coffee or tea have the highest proportion, except Adelaide, most people here brought instant coffee. Not many people bought fresh coffee in any of the city.
In Sydney, Melbourne and Hobart more than 60% of consumers bought fresh coffee, while in the remaining two cities less than 60%, in Brisbane around 51% and in Adelaide around 49%, respectively. In addition, majority in Adelaide bought instant coffee, about 50%. In other cities this is the second choice of cunsumer.
In all the cities, not many people prefer to go to a cafe for coffee or tea. In Sydney and Melbourne people who went to a cafe for coffee or tea were about 44% and 42%, respectively. Similarly, in Hobart only about 38%. Less than 35% people were interested to drink in a cafe in the remaining two cities.
AI examiner evaluation
| Criterion | Band |
|---|---|
| Task Achievement / Task Response | 4.5 |
| Coherence and Cohesion | 6.0 |
| Lexical Resource | 6.0 |
| Grammatical Range and Accuracy | 5.5 |
| Overall | 5.5 |
Task Achievement / Task Response: Band 4.5
The response identifies the survey’s topic and attempts an overview, but its central comparisons are repeatedly reversed, which makes the report only minimally accurate. It says café visits were the highest in every city except Adelaide, yet the figures for fresh coffee are then described as above 60% in Sydney, Melbourne and Hobart; in fact, café visits are highest in those cities, while fresh coffee is around 39–44%. The claim that café attendance was below 35% in Brisbane and Adelaide is also incorrect: it was about 56% and 50%. The overview does correctly note Adelaide’s relatively high instant-coffee figure, but the main features need to be selected and reported accurately. Check each series against the chart before comparing it.
Coherence and Cohesion: Band 6.0
The response has a clear overall arrangement: an introduction, an overview and two detail paragraphs. It also uses basic linking expressions such as “Overall,” “In addition” and “Similarly,” so the reader can follow the intended sequence. However, the progression is weakened because the detail paragraphs mix up the chart categories, and the final paragraph repeats the café comparison after the earlier overview has already mentioned it. References such as “this” in “In other cities this is the second choice” are not fully precise. To improve, group the figures by category or by clear city comparisons, and ensure each paragraph develops one accurate point without repeating it.
Lexical Resource: Band 6.0
There is an adequate range of task-related vocabulary, including “proportion,” “survey,” “consumers” and “majority,” and the writer attempts to vary expressions for the chart’s categories. Some choices, however, are inaccurate or unnatural: “people who goes to a cafe” and “people prefer to go” do not express the data as clearly as “the proportion of residents who visited a café.” “Result” is less suitable than “results,” while “cunsumer” is misspelled and “brought” is used where “bought” is intended. These errors do not generally prevent understanding, but they reduce precision. Use standard chart-reporting collocations consistently and check spelling and word forms.
Grammatical Range and Accuracy: Band 5.5
The response uses a mix of simple statements and some longer structures, including comparisons with “while” and “respectively.” Meaning is usually recoverable, but several grammatical errors remain. For example, “people who goes” has subject–verb disagreement, and “residents habit” needs a possessive form. The sentence beginning “Overall” shifts awkwardly from “people” to “most people here,” while “Less than 35% people” is missing an article or “of.” There is also inconsistent sentence control in “In Sydney, Melbourne and Hobart more than 60% of consumers bought fresh coffee, while in the remaining two cities less than 60%...” A more accurate range of comparative sentence patterns, with careful agreement and articles, would strengthen the report.
See this exact question answered at other band scores. The same prompt compared across bands.
Browse more IELTS Writing model answers or get your own writing scored by the same AI examiner.