Band 6.5 IELTS Writing Task 1 Model Answer
Overall Band Score: 6.5 · Cambridge IELTS 15 · 2026-11-08
IELTS Writing Task 1 question
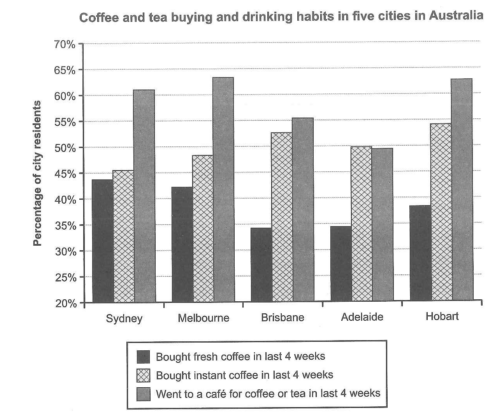
The chart below shows the results of a survey about people’s coffee and tea buying and drinking habits in five Australian cities.
Summarize the information by selecting and reporting the main features, and make comparisons where relevant.
Student answer (Band 6.5)
The bar chart illustrates the survey about coffee and tea buying and drinking habits of the people in five Australian cities. The given data is collected from last 4 weeks.
Overall, the habit of going to a cafe for coffee or tea is highest among all others, whereas the trend of buying fresh coffee is least popular. The habit of buying instant coffee stands at second position in all five cities.
In the five cities of Australia, most of the people prefer to visit a cafe for coffee or tea. In sydney, almost 62%, in Brisbaine 56% and in Melbourne and Hobart almost 65% residents follow this trend. Only in Adelaide, this habit has a slight low proprotion than buying instant coffee.
Many people also buy isntant coffee in these cities.The data records 46% people in Sydney, nearly 50% people in Melbourne, almost 55% in Brisbane, 50% in Adelaide and 54% in Hobart, who have habit of buying instant coffee. Percentage of people who buy fresh coffee is lowest in five cities. Nearly 45% in Sydney, less than 45% in Melbourne, less than 35% in Brisbane and Adelaide and less than 40% in Hobart.
AI examiner evaluation
| Criterion | Band |
|---|---|
| Task Achievement / Task Response | 7.0 |
| Coherence and Cohesion | 6.5 |
| Lexical Resource | 6.0 |
| Grammatical Range and Accuracy | 5.5 |
| Overall | 6.5 |
Task Achievement / Task Response: Band 7.0
The response identifies the main pattern clearly: café visits are generally the most popular activity, while fresh coffee purchases are usually lowest, and it notes Adelaide as the exception where café attendance is slightly below instant-coffee buying. The city figures are mostly consistent with the chart, and the overview gives the reader a useful summary. This meets the task well, with relevant comparisons and supporting data. However, the claim that instant coffee is “second position in all five cities” is too broad: in Adelaide, café visits are marginally lower than instant coffee, but fresh coffee is also lower, so the ranking is not consistently expressed with precision. A more exact overview and clearer comparison of the Adelaide exception would strengthen the report.
Coherence and Cohesion: Band 6.5
The response has a clear overall structure: an introduction, an overview, and two paragraphs presenting café attendance and coffee purchases. Information is generally grouped sensibly, and phrases such as “Overall,” “In the five cities,” and “Many people also” help signal progression. This is coherent and easy to follow. To make the organisation more flexible and polished, avoid repeating the same city-by-city listing pattern and connect comparisons more explicitly—for example, contrast the higher café figures in Melbourne and Hobart with Adelaide’s lower result. There are also small spacing and punctuation issues, such as the extra space in “cafe for” and the missing space after “cities.” These do not disrupt the message, but smoother linking and editing would improve cohesion.
Lexical Resource: Band 6.0
The vocabulary is adequate for describing the chart, with relevant terms such as “survey,” “proportion,” “residents,” and “buying instant coffee.” The writer also attempts variation through phrases like “habit of going to a cafe” and “follow this trend.” However, some choices are imprecise or repetitive: “habit” is used repeatedly where “proportion” or “share” would be more suitable, and “stands at second position” is an awkward collocation. Spelling errors—including “Brisbaine,” “isntant,” and “proprotion”—also reduce accuracy. Aim for concise chart language and check spelling carefully; for example, use “the percentage who visited cafés” rather than repeatedly describing a “habit.”
Grammatical Range and Accuracy: Band 5.5
The response uses a mixture of simple and more developed sentence forms, including the contrast in “Only in Adelaide, this habit has a slight low proportion than buying instant coffee.” Most meanings remain understandable, and the data descriptions are generally presented in complete sentences. However, some grammatical patterns are awkward or inaccurate. “The given data is collected from last 4 weeks” uses an unsuitable tense and preposition; “The data records 46% people” is missing a grammatical link such as “of”; and “who have habit” needs an article. Sentence punctuation and spacing also need careful checking. Practise accurate comparative structures and article use, while retaining the range of sentence forms already attempted.
See this exact question answered at other band scores. The same prompt compared across bands.
Browse more IELTS Writing model answers or get your own writing scored by the same AI examiner.