Band 6.0 IELTS Writing Task 1 Model Answer
Overall Band Score: 6.0 · Cambridge IELTS 15 · 2026-11-09
IELTS Writing Task 1 question
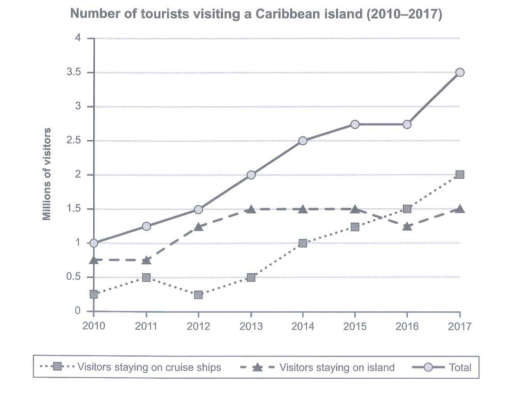
The graph below shows the number of tourists visiting a particular Caribbean island between 2010 and 2017.
Summarize the information by selecting and reporting the main features and make comparisons where relevant.
Student answer (Band 6.0)
The graph illustrates the number of visitors, visting a specific Caribbean island between 2010 and 2017. Number of visitors are represented in millions.
Overall, for the whole period upward trend was recorded with slight flactuations. Visitors staying on cruise ships followed highest trend. For the whole period, number of visitors was increased significantly.
Starting from 2010, the total number of visitors was 1 million from which the number of visitors staying on cruise ships was 0.3 million and for staying on island was 0.8 million. The total number of tourists increased and peaked at the value of 3.5 million in 2017. In 2011, members for cruise ships were 0.5 million that followed the downward trend and bottom at 0.3 million in 2012 and then till 2017 the line started rising and finally reached at 2 million.
For the visitors staying on island, the ratio started from 0.8 millions and remained constant untill 2011 and then followed the updward trend and reached at the value of 1.5 million in 2013. For 2013, 2014 and 2015 value remained constant and then fluctuated downward at 1.3 million. In the last year, it again joined the trend and was 1.5 million.
AI examiner evaluation
| Criterion | Band |
|---|---|
| Task Achievement / Task Response | 6.0 |
| Coherence and Cohesion | 6.0 |
| Lexical Resource | 5.5 |
| Grammatical Range and Accuracy | 5.5 |
| Overall | 6.0 |
Task Achievement / Task Response: Band 6.0
You identify the main overall rise and report several useful details, including the total reaching 3.5 million in 2017 and cruise-ship visitors increasing to 2 million. The island-stayer figures are also mostly represented accurately: they level off at about 1.5 million, dip in 2016, and recover in 2017. However, the overview is unclear when it says cruise-ship visitors “followed highest trend”; island visitors were higher until the final year. The claim of “slight fluctuations” is also too general to capture the contrasting patterns. Some details are imprecise: the cruise figure falls to about 0.25 million in 2012, and the total is level at about 2.75 million in 2015–16. A clearer comparison of the two groups would make the summary more complete.
Coherence and Cohesion: Band 6.0
The response has a recognisable structure: an introduction, an overview, and separate paragraphs describing the figures. The chronological sequencing helps readers follow changes, particularly in the cruise-ship series. However, cohesion is sometimes mechanical or unclear. Phrases such as “For the whole period” are repeated, while “followed the downward trend” and “then till 2017” do not clearly identify the subject or the exact movement. The final paragraph also shifts between years without consistently linking the figures to the overall comparison. Use clearer transitions and references—for example, contrast the steady island-stayer total with the stronger late rise in cruise visitors—so the progression is easier to follow.
Lexical Resource: Band 5.5
You use relevant chart vocabulary, including “increased,” “remained constant,” “peaked,” and “fluctuated,” which allows you to describe the main movements. There is also some attempt at more formal reporting language. However, several word choices and collocations are inaccurate or awkward, such as “followed highest trend,” “members for cruise ships,” “the ratio started,” and “joined the trend.” These expressions make parts of the report less precise. Spelling errors such as “visting,” “flactuations,” “untill,” and “updward” also reduce control. Choose standard data-reporting phrases such as “the number of cruise-ship visitors,” “the figure,” and “rose to,” and check spelling carefully.
Grammatical Range and Accuracy: Band 5.5
You attempt a mix of simple and more complex sentences, including clauses beginning “from which” and “and then,” and the overall meaning is generally understandable. Some grammatical errors remain, however. For example, “Number of visitors are represented” has a number-agreement problem, while “the number of visitors was increased” uses an unsuitable passive construction. In “the ratio started from 0.8 millions,” the article, noun choice, and plural form do not fit the intended meaning; “the figure began at 0.8 million” would be more accurate. There are also awkward sentence patterns in “reached at 2 million” and “For 2013, 2014 and 2015 value remained constant.” Practise accurate reporting structures and check articles, agreement, and sentence boundaries.
See this exact question answered at other band scores. The same prompt compared across bands.
Browse more IELTS Writing model answers or get your own writing scored by the same AI examiner.