Band 5.5 IELTS Writing Task 1 Model Answer
Overall Band Score: 5.5 · Cambridge IELTS 15 · 2026-11-10
IELTS Writing Task 1 question
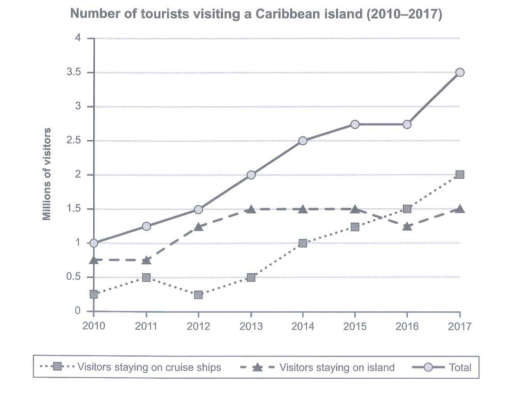
The graph below shows the number of tourists visiting a particular Caribbean island between 2010 and 2017.
Summarize the information by selecting and reporting the main features and make comparisons where relevant.
Student answer (Band 5.5)
The given graph tells us about the number of tourists visiting a particularly carbiean island between 2010 and 2017. They gives information about tourist which staying on the cruise ships and staying on island between 2010 to 2017.
The graph gives the information about tourist that visiting a particular caribbean island between 2010 and 2017. The rate will be constantly increases from 2010 to 2017. The ratio of visitor stay on island is decreases from previous records, and the rate of visitors staying on cruise ships is increases per year.
Now check the whole detail of graph that is given. First check the reading of visitors staying on cruise ship. In year 2010 and 2012, both years 0.25 millions visitors staying on cruise ship. 2011 and 2013, similarly 0.5 millions visitors staying. 2014, 1 millions visitors staying. 2015, 1.25 millions. 2016, 1.5 millions. And 2017, 2 millions visitors staying on cruise ships. The visitors staying on island. In 2010 and 2011 both are same numbers of visitors stayin on island 0.75 millions. 2012, and 2016, 1.25 million visitors . 2013, 2014, 2015, and 2017, they all have similar result 1.5 millions.
The total result after adding both visitors staying in cruise ship and on island. 2010. 1 million visitors. 2011, 1.25 million. 2012, 1.5 million visitors. 2013, 2 million visitors. 2014, 2.5 million. 2015 and 2016, both have similar result 2.75 millions visitors. 2017, 3.5 millions visitors are visiting to caribbean island.
AI examiner evaluation
| Criterion | Band |
|---|---|
| Task Achievement / Task Response | 5.5 |
| Coherence and Cohesion | 5.5 |
| Lexical Resource | 5.0 |
| Grammatical Range and Accuracy | 5.0 |
| Overall | 5.5 |
Task Achievement / Task Response: Band 5.5
You report the three series and give many figures that match the graph, including the total rising from 1 million in 2010 to 3.5 million in 2017, and the cruise-ship figure reaching 2 million. However, the overview is unclear and includes an inaccurate trend: you say the number staying on the island “is decreases,” although it generally rises from 0.75 million to 1.5 million, with a dip in 2016. The claim that cruise-ship visitors increase “per year” also overlooks the falls between 2011 and 2012 and between 2013 and 2014? (The figures show a fall only in 2012.) Focus the overview on the overall growth in total visitors and the contrasting patterns of the two groups, rather than repeating detailed figures without interpreting them.
Coherence and Cohesion: Band 5.5
The response has a basic sequence: an introduction, a brief overview, and separate descriptions of cruise-ship visitors, island visitors, and totals. This makes the information possible to follow, and phrases such as “First check” signal a change of focus. However, the opening repeats the same task description, while “Now check the whole detail” is an awkward transition and the report reads largely as a list of figures. Some links between ideas are unclear, particularly the overview’s claim that island visitors decrease before the later figures show their fluctuations. Use distinct paragraphs for the introduction, a concise overview, and grouped comparisons, with linking language that explains trends rather than simply announcing the next series.
Lexical Resource: Band 5.0
Your vocabulary is sufficient to identify the graph’s categories and report quantities, using terms such as “visitors,” “total,” and “millions.” However, the range is limited and several word choices or collocations are inaccurate or repetitive. “The rate” is not the most suitable term for visitor numbers, and “the ratio of visitor stay on island” does not clearly describe the number of people in that category. The spelling of “Caribbean” is inconsistent, and “particularly carbiean” is also an inaccurate rendering of “particular Caribbean.” Aim for precise, natural phrases such as “the number of visitors staying on the island” and “the total number of tourists,” and avoid repeating “the graph gives the information” in the introduction and overview.
Grammatical Range and Accuracy: Band 5.0
The response communicates the main figures, but grammatical control is inconsistent and sentence structures are mostly simple or fragmentary. Errors include “They gives information,” “The rate will be constantly increases,” and “the ratio … is decreases,” where subject–verb agreement and verb forms are faulty. Several data statements are incomplete sentences, for example “2015, 1.25 millions” and “2017, 2 millions visitors staying on cruise ships.” Articles, plurals, and sentence boundaries also need attention. Practise writing complete comparisons with accurate past-tense verbs, such as “The number of cruise-ship visitors rose to 2 million in 2017,” and check agreement and singular/plural forms before submitting. More accurate control of these basic patterns would make the report easier to read.
See this exact question answered at other band scores. The same prompt compared across bands.
Browse more IELTS Writing model answers or get your own writing scored by the same AI examiner.