Band 5.0 IELTS Writing Task 1 Model Answer
Overall Band Score: 5.0 · Cambridge IELTS 15 · 2026-11-10
IELTS Writing Task 1 question
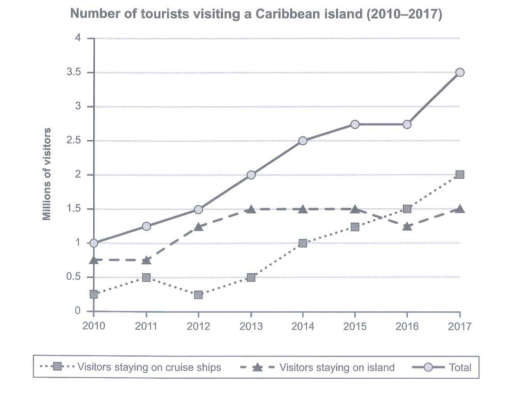
The graph below shows the number of tourists visiting a particular Caribbean island between 2010 and 2017.
Summarize the information by selecting and reporting the main features and make comparisons where relevant.
Student answer (Band 5.0)
The graph below illustrates the number of tourists visiting a carribean island from 2010 to 2017.
Overall , through the years the total of visitors had a dramatic increase ,reaching its peak at 2017 with 3.5 millions , while through this period the number of tourists who prefered to stay on the island was higher than who stayed on the cruise ships , but starting with 2015 the numbers changed for the cruise ships to take the lead.
The number of tourists who visited this caribbean island during 2010 to 2017 had such a significant increase foing from 1 millions to 3.5 in the spam of 7 years , from 2010 to 2015
the numbers of tourists kept rising significaly to reach around 2.7 millions by 2015 ,whatever through the next year the total of visitors stayed constant for it to peak again during the later year , during 2016 to 2017 the total rose to hit 3.5 millions .
The total of tourists to prefered staying on the island in 2010 surpassed the the cruise ships with around 0.75 and 0.25 , respectively ,while numbers of island stayers started rising in 2011 the alternative happened to cruise ships stayers . it actually marked a decrease to start increasing again by 2012 , from 2016 the visitors who stayed on cruise ships surpassed the island stayers with over 0.5 millions.
AI examiner evaluation
| Criterion | Band |
|---|---|
| Task Achievement / Task Response | 5.5 |
| Coherence and Cohesion | 5.0 |
| Lexical Resource | 5.0 |
| Grammatical Range and Accuracy | 5.0 |
| Overall | 5.0 |
Task Achievement / Task Response: Band 5.5
You identify the main overall rise in total visitors, the peak of 3.5 million in 2017, and the changing comparison between island and cruise-ship visitors. These are relevant features, and several figures are accurate, including the 2010 breakdown. However, the account is only partly complete: it gives little clear detail about the island-stayer trend after 2012, and the statement that cruise-ship visitors took the lead “starting with 2015” is inaccurate, since island visitors remained higher through 2016 and cruise visitors overtook them only in 2017. The overview also says island visitors were higher “through this period,” which conflicts with the later comparison. Select the key stages more precisely and report the crossover accurately.
Coherence and Cohesion: Band 5.0
The response has a recognisable structure, with an overview followed by paragraphs about total visitors and the two visitor categories. This gives the reader some organisation. However, progression within the paragraphs is uneven: the second paragraph repeats the overall rise already stated, while the final paragraph moves between years and categories without a consistently clear sequence. Linking expressions such as “whatever,” “while,” and “from 2016” are sometimes used inaccurately or awkwardly, and the long sentences joined by commas make relationships between points difficult to follow. Use a clearer chronological order, avoid repeating the overview, and divide complex comparisons into shorter sentences with precise links.
Lexical Resource: Band 5.0
You use some relevant vocabulary for describing trends, including “dramatic increase,” “rising,” “decrease,” “surpassed,” and “peak.” This shows an attempt to vary language rather than rely only on basic terms. However, the range is limited and several choices or forms are inaccurate, which sometimes makes the meaning less clear: “the total of visitors,” “the spam of 7 years,” and “the numbers changed for the cruise ships to take the lead” are not natural expressions in this context. There are also noticeable spelling errors, including “carribean,” “prefered,” and “significaly.” Build a more precise set of chart-description phrases and check spelling and collocations carefully.
Grammatical Range and Accuracy: Band 5.0
You attempt longer sentences and use some subordinate clauses to compare trends, but complex structures are often faulty, and many sentences contain errors that make the information harder to process. For example, “the number of tourists who prefered to stay on the island was higher than who stayed on the cruise ships” has an incomplete comparison, while “from 2016 the visitors who stayed on cruise ships surpassed the island stayers” needs clearer grammatical framing and does not match the data. Comma splices and inconsistent tense use also occur, especially in the long second and third paragraphs. Practise forming complete comparisons and separating independent clauses with full stops; use past-tense forms consistently when describing the chart.
See this exact question answered at other band scores. The same prompt compared across bands.
Browse more IELTS Writing model answers or get your own writing scored by the same AI examiner.