Band 5.0 IELTS Writing Task 1 Model Answer
Overall Band Score: 5.0 · Cambridge IELTS 15 · 2026-11-11
IELTS Writing Task 1 question
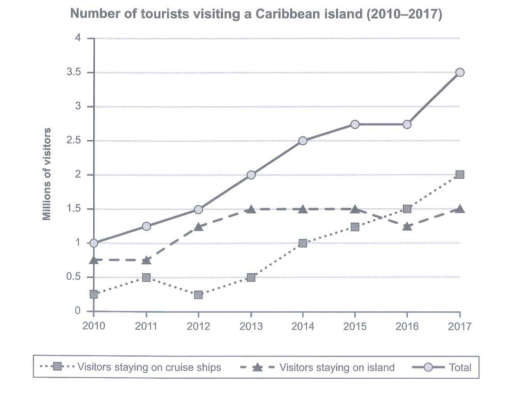
The graph below shows the number of tourists visiting a particular Caribbean island between 2010 and 2017.
Summarize the information by selecting and reporting the main features and make comparisons where relevant.
Student answer (Band 5.0)
The line graph illustrates the number of tourists visiting a particular Caribbean island from 2010 to 2017.
Overall, it is evident that all categories are rose. whereas, total tourists visiting a Caribbean island are seen significantally increase.
To begin, In 2010, the number of tourists visited in Caribbean island total was 1 million. it moved upward around 1.3 million tourists in 2012, after that category was rose again significantally 2 million people in 2013, then increased value 2.5 million visitors in 2014. while the trend was move minimally 2.7 in 2015. after that trend was leveled off between 2015 and 2016. the trend was increased rapidly approximately 3.5 million toursits.
In contrast, in 2010, visitors staying on island was 0.8 then levelled off in 2011, after that category was increased to 1.5 million tourist in 2013. then the category was platauaed from 2013 to 2015 after that category was declined 1.3 million then rose again 1.5 million, whereas visitors staying on island was 0.3 million tourists then rose 0.5 million 2011, after that decreased around 0.3 million, then category was increased at 1 million in 2014, again value was increased to 2017 million.
AI examiner evaluation
| Criterion | Band |
|---|---|
| Task Achievement / Task Response | 5.5 |
| Coherence and Cohesion | 5.0 |
| Lexical Resource | 5.0 |
| Grammatical Range and Accuracy | 5.0 |
| Overall | 5.0 |
Task Achievement / Task Response: Band 5.5
You identify the period and report several important movements, including the overall rise in total visitors and the island-stay figure’s plateau and later recovery. However, the overview is unclear and partly inaccurate: “all categories are rose” does not reflect that island visitors fell from about 1.5 million to 1.25 million in 2016. The final comparison also becomes confused: the cruise-ship series is described as reaching “2017 million,” rather than about 2 million in 2017. Some figures are broadly accurate, such as the total reaching 2.5 million in 2014, but the response does not consistently distinguish the two visitor groups. A clearer overview and accurate reporting of the cruise-ship trend would make the key features more complete and reliable.
Coherence and Cohesion: Band 5.0
The response has a basic structure, with an introduction, an overview and paragraphs describing the data. It also attempts to signal sequence and contrast through phrases such as “To begin” and “In contrast.” However, progression within the body paragraphs is difficult to follow, especially in the final sentence, where the account shifts from island visitors to cruise-ship visitors without a clear transition. Several connectors are repetitive or awkwardly placed, including repeated uses of “after that,” and sentence boundaries are often unclear. Grouping the total figures in one paragraph and the two visitor categories in a clearly labelled comparison paragraph, with more precise linking, would help the reader follow the information.
Lexical Resource: Band 5.0
You use some relevant vocabulary for describing data, including “levelled off,” “declined,” “increased” and “approximately.” This gives you a basic range for reporting trends. However, word choice and collocation are often inaccurate or repetitive: “the trend was move minimally” and “the category was platauaed” are not natural descriptions, while “toursits” and “significantally” contain spelling errors. “Tourists visited in Caribbean island total” is also difficult to interpret. Aim for accurate, conventional phrases such as “the total number of visitors rose” and “the figure remained stable.” Check spelling carefully and use distinct terms for the total and each visitor group so that the data are easier to understand.
Grammatical Range and Accuracy: Band 5.0
You attempt both simple and longer sentences, but control is inconsistent, and errors frequently make relationships between figures harder to understand. Examples include “all categories are rose,” “the trend was move minimally,” and “visitors staying on island was 0.8,” which show problems with verb forms, agreement and sentence construction. Capitalisation and punctuation also disrupt the flow: several sentences begin with lowercase “it,” “after” or “then,” and full stops are sometimes used where the ideas need clearer sentence structure. Practise forming accurate past-tense sentences, for example, “The total rose to 2.5 million in 2014,” and use shorter sentences when describing several changes. This will improve clarity while you build more varied structures.
See this exact question answered at other band scores. The same prompt compared across bands.
Browse more IELTS Writing model answers or get your own writing scored by the same AI examiner.