Band 5.0 IELTS Writing Task 1 Model Answer
Overall Band Score: 5.0 · Cambridge IELTS 15 · 2026-11-11
IELTS Writing Task 1 question
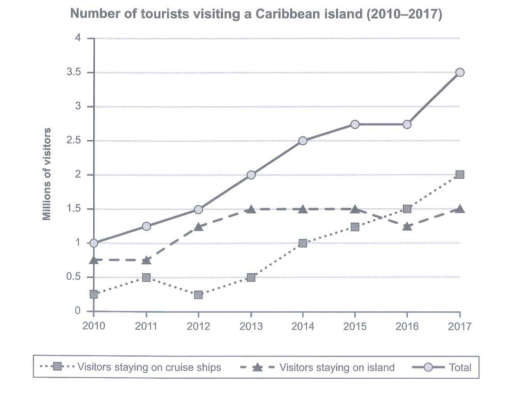
The graph below shows the number of tourists visiting a particular Caribbean island between 2010 and 2017.
Summarize the information by selecting and reporting the main features and make comparisons where relevant.
Student answer (Band 5.0)
The line graph shows the number of tourist who are vivitinga particular Caribben island between 2010 and 2017.
Overall the number of tourists visiting a caribbean island 2010 to 2017. Three different kind of visitors lines square line indicates visitors staying on cruise ships second arrow lines visitors staying on island and third the the doted lines indicates total.
So in the total line that is in 2010 is 1 and it is average and by the time it upgraded and it was 3.5 in 2017. The visitors staying on island line was at 0.8 in 2010 and low then the total one it remains same in 2011 afterwards it imporves and jiggle in year 2016 then bit improves in 2017.
At last the visitors staying on cruise ships line was very low in year 2010 it was 0.3 it improves then little jiggle in 2012 then jumped in year 2017.
AI examiner evaluation
| Criterion | Band |
|---|---|
| Task Achievement / Task Response | 5.5 |
| Coherence and Cohesion | 5.5 |
| Lexical Resource | 5.0 |
| Grammatical Range and Accuracy | 4.5 |
| Overall | 5.0 |
Task Achievement / Task Response: Band 5.5
You identify the chart’s subject and report the overall rise in total visitors, from 1 million in 2010 to 3.5 million in 2017. You also mention that island-based visitors levelled off before changing slightly, and that cruise-ship numbers rose overall. However, the overview is unclear: the paragraph beginning “Overall” mainly describes the line styles rather than summarising the main trends. Some details are imprecise or incomplete; for example, the island figure in 2017 returns to about 1.5 million, while cruise-ship visitors reach 2 million, but these endpoint values are not clearly stated. To strengthen the response, give a concise overview of the contrasting trends and support it with accurate comparisons across the period.
Coherence and Cohesion: Band 5.5
The response has separate paragraphs for an introduction, an overview, and the two visitor categories, so there is some organisation. The sequence from total visitors to island visitors and then cruise-ship visitors is understandable. However, progression is weakened by the overview’s focus on identifying line styles and by unclear links such as “So in the total line that is in 2010.” Several sentences are fragments or difficult to follow, and “At last” does not clearly signal the final category. Use a clearer paragraph plan: introduce the graph, summarise the main trends, then compare the two categories with relevant figures. Connect ideas with simple, accurate transitions rather than relying on vague references such as “it” and “the total one.”
Lexical Resource: Band 5.0
Your vocabulary includes some relevant chart language, such as “visitors,” “total,” “remains same,” and “improves,” which helps communicate the general direction of change. However, the range is limited and several choices are inaccurate or informal for describing data. “Upgraded” does not mean that a figure increased, while “jiggle” is not an appropriate description of a small fluctuation. There are also noticeable spelling errors, including “vivitinga,” “Caribben,” and “imporves,” which can distract the reader. Build a small set of precise trend expressions—such as “rose steadily,” “remained stable,” and “fluctuated”—and use them consistently. Check spelling and choose terms that describe numerical movement rather than general improvement.
Grammatical Range and Accuracy: Band 4.5
You attempt to describe changes over time using past-tense verbs and some longer sentence patterns, but control is inconsistent. Errors in sentence structure and agreement appear in examples such as “the number of tourist who are viviting” and “Three different kind of visitors lines square line indicates.” The sentence “Overall the number of tourists visiting a caribbean island 2010 to 2017” lacks a complete main clause, while “it remains same in 2011” has an incomplete verb phrase. These problems sometimes make relationships between figures difficult to understand. Practise writing complete sentences with a clear subject and verb, and use consistent past tense for the period shown. Then check articles, plurals, and punctuation before finishing.
See this exact question answered at other band scores. The same prompt compared across bands.
Browse more IELTS Writing model answers or get your own writing scored by the same AI examiner.