Band 6.0 IELTS Writing Task 1 Model Answer
Overall Band Score: 6.0 · Cambridge IELTS 15 · 2026-11-11
IELTS Writing Task 1 question
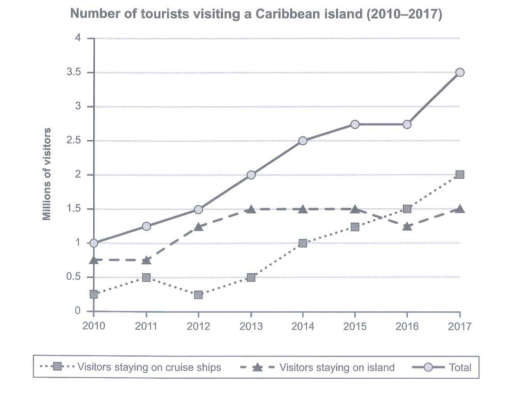
The graph below shows the number of tourists visiting a particular Caribbean island between 2010 and 2017.
Summarize the information by selecting and reporting the main features and make comparisons where relevant.
Student answer (Band 6.0)
The line graph presents the number of travelers staying a certain caribbean island from 2010 to 2017.
Overall, the number of travelers considerably increase, the travelers staying on cruise ships also increase while the travelers staying on island decrease in few years but the starts goes up.
However, the number of visitors staying on cruise ships increase every year except in the year of 2012. The proportions of travelers in 2010 it was 0.2 million while it goes up to 0.5 million 2011 then goes down to 0.2 million in 2012 after that it goes upward in the half of 2015 it surpassed the proportions of travelers staying on island. While the travelers staying on island was largely high in past years in 2010 it was 0.8 million and reamin same till 2011 and it goes up and the highest point is 1.5 millon in the year 2013 and remains same for next 2 years then start falling down and the ratio was 1.2 million in 2016 but then start increase and come back to 1.5 million in 2017.
The total number of travelers increase every year the proportions of total travelers was 1 million on 2010 and the it goee upward every year till 2015 the remain same for one year and the ratio was 2.7 million then it start increase and be end of the 2017 the number increase to 3.5 million.
AI examiner evaluation
| Criterion | Band |
|---|---|
| Task Achievement / Task Response | 6.5 |
| Coherence and Cohesion | 6.0 |
| Lexical Resource | 5.5 |
| Grammatical Range and Accuracy | 5.0 |
| Overall | 6.0 |
Task Achievement / Task Response: Band 6.5
You cover all three series and identify the main overall rise in total visitors, the strong growth in cruise-ship visitors, and the comparatively stable pattern for visitors staying on the island. Several figures and turning points are also reported accurately, including the island figure reaching about 1.5 million in 2013 and the total reaching 3.5 million in 2017. This gives the response a solid overview, with some detail beyond the broad trends. However, the overview says island visitors “decrease in few years,” which is not a clear summary of their overall pattern, and the claim that cruise visitors increase “every year except” 2012 overlooks their fall from 0.5 to 0.25 million in that year. To strengthen the response further, make the overview more precise and check each comparison against the graph.
Coherence and Cohesion: Band 6.0
The response has a recognisable structure: an introduction and overview are followed by paragraphs about the two visitor categories and the total. This makes the information broadly easy to follow, and the sequence from 2010 to 2017 is generally maintained. However, connections between ideas are sometimes mechanical or unclear. The repeated use of “then,” “while,” and “and” creates long chains, particularly in the paragraph about island visitors, where several changes are packed into one sentence. Some references are also difficult to interpret, such as “the starts goes up” and “the proportions of travelers.” Use shorter sentences to separate trends, and organise each detail paragraph around a clear comparison or time period. More precise linking would make the progression smoother.
Lexical Resource: Band 5.5
You use relevant vocabulary for describing a graph, including “increase,” “remains,” “highest point,” “falling down,” and “surpassed.” These choices allow the reader to understand the main movements, and there is some attempt to vary the language. However, the range is limited and several expressions are imprecise or unnatural for data description. “Proportions” is repeatedly used where “number” or “figure” is intended, while “the ratio was 2.7 million” does not accurately describe a total. Phrases such as “largely high” and “come back to 1.5 million” are also awkward. Spelling errors, including “caribbean,” “reamin,” and “millon,” further reduce accuracy. Build a more precise set of trend and quantity terms, and check spelling and collocations.
Grammatical Range and Accuracy: Band 5.0
You attempt both simple and longer sentence forms, and the reader can usually follow the intended comparisons. However, control is inconsistent, especially in longer sentences that combine several trends. Verb forms and agreement are often inaccurate: “the number of travelers considerably increase,” “the travelers staying on cruise ships also increase,” and “the total number … increase” need appropriate tense and agreement. There are also problems with sentence construction and punctuation, as in “The proportions of travelers in 2010 it was 0.2 million,” which contains an unnecessary repeated subject and lacks a clear clause structure. The final paragraph similarly runs several ideas together. Use past-tense forms consistently for the historical data, check subject–verb agreement, and divide complex descriptions into complete, punctuated sentences.
See this exact question answered at other band scores. The same prompt compared across bands.
Browse more IELTS Writing model answers or get your own writing scored by the same AI examiner.