Band 5.5 IELTS Writing Task 1 Model Answer
Overall Band Score: 5.5 · Cambridge IELTS 15 · 2026-11-12
IELTS Writing Task 1 question
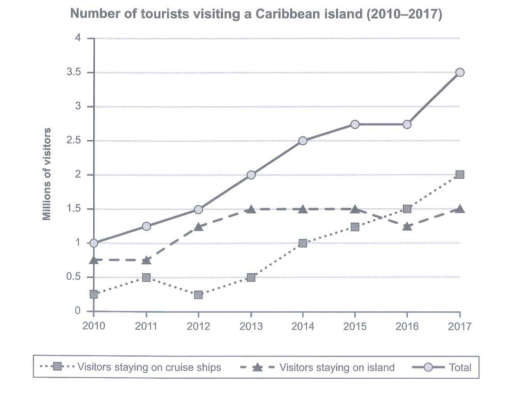
The graph below shows the number of tourists visiting a particular Caribbean island between 2010 and 2017.
Summarize the information by selecting and reporting the main features and make comparisons where relevant.
Student answer (Band 5.5)
The line graph depicts the number of tourists visiting a Caribbean island from 2010 to 2017.
Overall, the graph shows the number of visitors in different lines. The vistors staying on cruise ships are the highest proportion whereas the number of visitors staying on island account for the lowest share.
In 2010, visitor on ship are less then 0.5 millions then fluctuated in different years and then rose sharply to 1 million in 2014. Then steadily increased in next years to 2017 upto 2 millions.
In 2010, visitors are stayed on island are remain same in 2011 upto 0.8 millions. Then in 2011 they surged upto 1.5 millions in 2013. In 2014, visitors are declined steadily upto 2016 and then further increase. Then at last third line illustrates the total number of visitors. This line combined both lines of visitors staying on ship or staying on island .Hence, in 2017there are 3.5 millions total visitors.
AI examiner evaluation
| Criterion | Band |
|---|---|
| Task Achievement / Task Response | 5.5 |
| Coherence and Cohesion | 6.0 |
| Lexical Resource | 5.5 |
| Grammatical Range and Accuracy | 5.0 |
| Overall | 5.5 |
Task Achievement / Task Response: Band 5.5
You identify the chart’s subject and include an overview, but the overview misrepresents the main comparison: cruise-ship visitors are not the highest throughout, and island visitors are not consistently the lowest; island stays exceed cruise stays in most earlier years. The report also omits the overall total trend, which rises from about 1 million to 3.5 million, and gives limited comparison between the series. Some details are inaccurate: island visitors rise to about 1.25 million in 2012 and 1.5 million in 2013, rather than surging to 1.5 million in 2011; they then remain around 1.5 million until 2015, dip in 2016, and recover in 2017. Select the key turning points and describe them accurately.
Coherence and Cohesion: Band 6.0
The response has a recognisable structure: an introduction, an overview, and paragraphs describing the visitor categories. The sequence from cruise-ship visitors to island visitors and then the total is generally understandable. However, progression is weakened by unclear or repetitive transitions, such as “Then” appearing repeatedly, and by the abrupt shift to the total in the final sentence. The reference “This line” is also vague because the reader must infer which line is meant. Grouping the figures into a clearer comparison—for example, describing the two categories together before summarising the total—would improve flow. Use linking phrases to show contrast and change, rather than relying mainly on chronological “then” statements.
Lexical Resource: Band 5.5
You use some relevant trend vocabulary, including “fluctuated,” “rose sharply,” “steadily increased,” and “declined,” which helps communicate changes in the graph. However, the range is limited and several choices are inaccurate or awkward: “highest proportion” does not describe the series correctly, while “surged” overstates the island visitor trend. There are also spelling and word-form errors, including “vistors,” “upto,” and “millions” where “million” is needed after a number. Aim for precise chart language and accurate collocations, such as “the figure for cruise-ship visitors” and “the total number of visitors.” Vary verbs for increases, decreases, and stability, while ensuring each verb matches the size and direction of the change.
Grammatical Range and Accuracy: Band 5.0
You attempt both simple and more extended sentences, but grammatical control is inconsistent, and errors sometimes make the timeline difficult to follow. Examples include “visitor on ship are less,” “visitors are stayed on island are remain same,” and “Then in 2011 they surged upto 1.5 millions in 2013.” These contain problems with agreement, verb forms, and sentence construction. The sentence beginning “This line combined both lines” also needs a clearer grammatical structure. Use past simple consistently for the historical data, with forms such as “the figure rose” or “visitors stayed,” and check subject–verb agreement and articles. Shorter, accurately formed sentences would help before you attempt more complex comparisons.
See this exact question answered at other band scores. The same prompt compared across bands.
Browse more IELTS Writing model answers or get your own writing scored by the same AI examiner.